Overlooked Stocks and Charts — How to Read the Liquidity Trap
Why the usual technical signals fail in thinly traded, overlooked stocks, and how the spread, slippage and market impact of thin liquidity distort candles, indicators and exits.

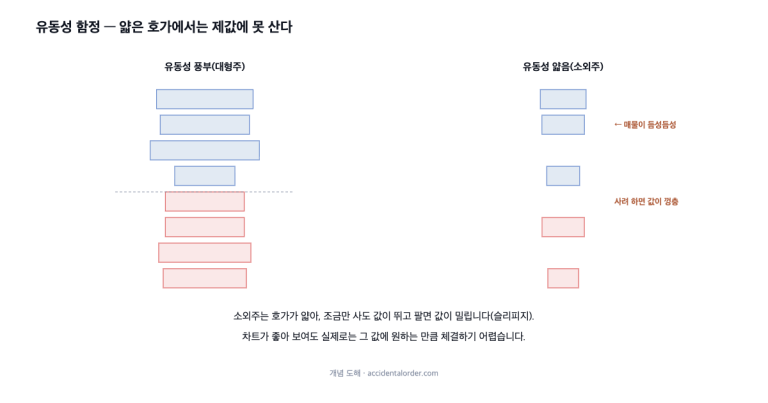
Why the usual technical signals fail in thinly traded, overlooked stocks, and how the spread, slippage and market impact of thin liquidity distort candles, indicators and exits.
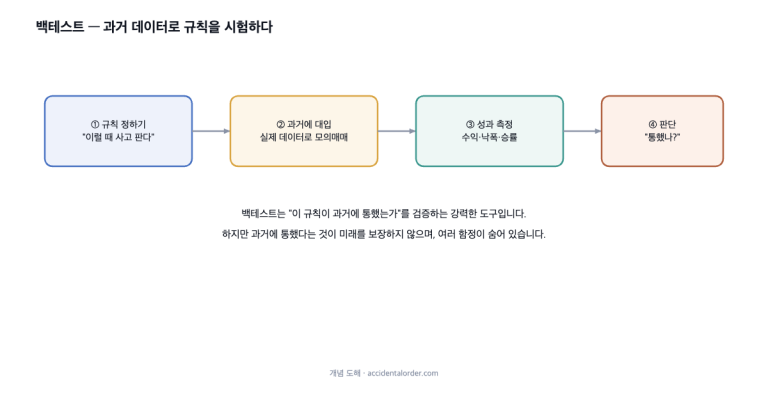
What a backtest is and why dazzling results should not be trusted at face value — overfitting, look-ahead bias, survivorship bias, trading costs and data snooping, plus how to verify honestly.
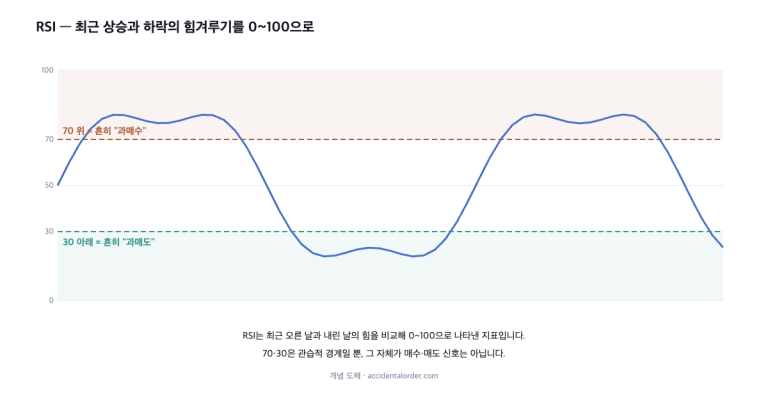
What RSI and MACD actually calculate, and why rules such as “buy at 30, sell at 70” break down — shown with Monami’s June–July 2026 price action.
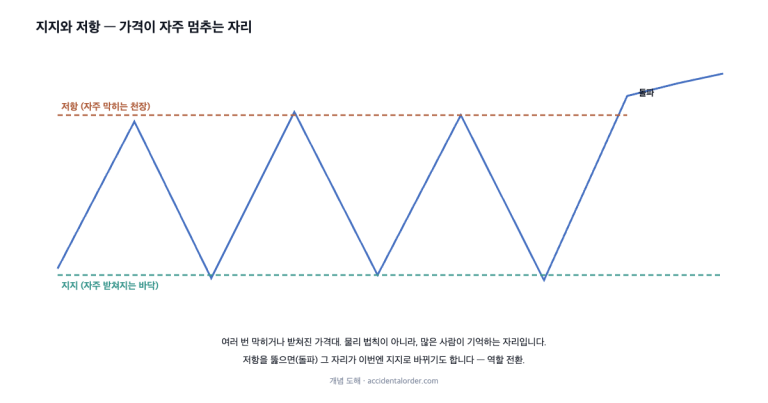
Support and resistance are psychological levels people remember, not walls that hold prices. KT&G’s 2024 trading range shows both their force and their limits.
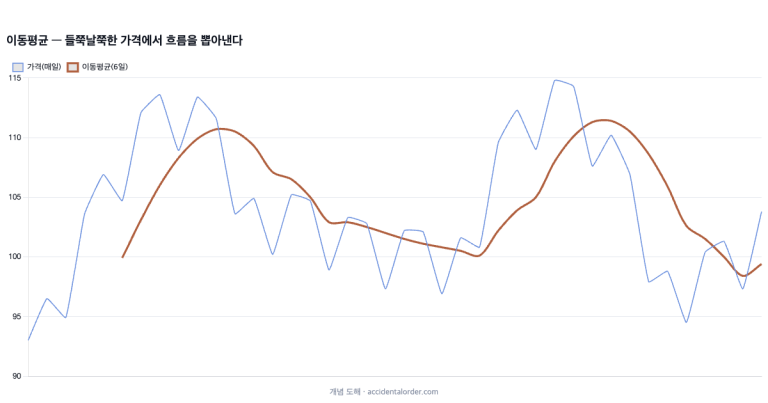
Moving averages smooth jagged prices into a readable trend, but they lag by construction. Why golden crosses are weaker than they look, and how to use trend tools as context, not instructions.
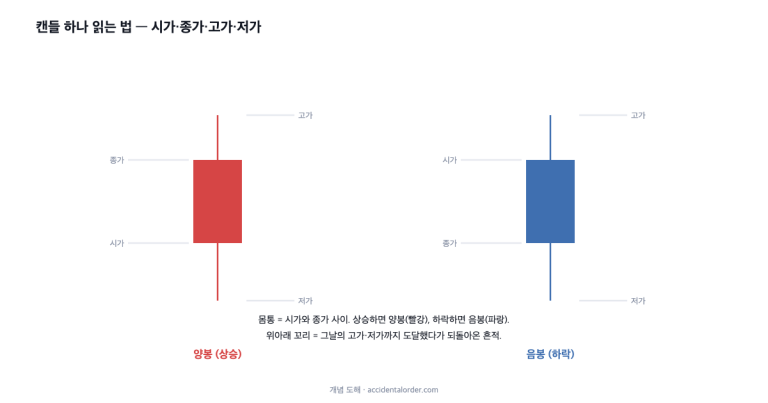
Open, close, high and low, bodies and tails, and volume as the weight behind a move — read through Monami’s July 2026 surge, with a clear line drawn at what candles cannot predict.