Overlooked Stocks and Charts — How to Read the Liquidity Trap
There are stocks in the market that nobody looks at. No brokerage report is ever published on them, daily turnover amounts to only a few hundred million won, and a news search turns up nothing but a single disclosure line from months ago. Stocks like these are called overlooked stocks. Because they have been pushed out of view, their prices are sometimes left cheap, which makes them attractive hunting grounds for investors looking for undervaluation. Yet that very neglect becomes a trap when you look at the chart. This article sets out, at a beginner’s level, what is different about reading the chart of an overlooked stock and why the usual technical signals do not work well there, and then layers on top of that the market-microstructure reality of liquidity.
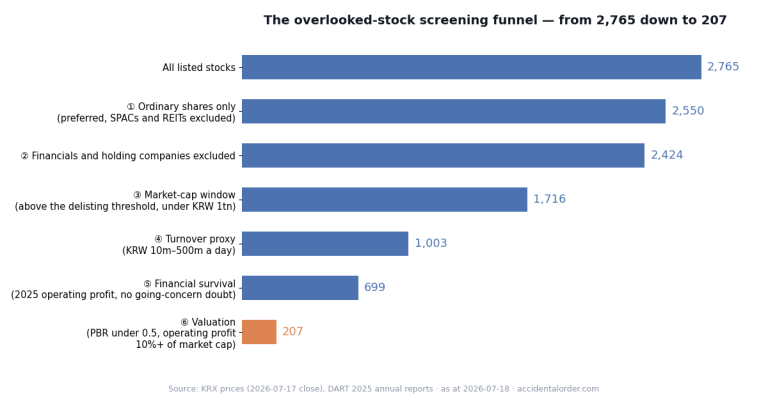
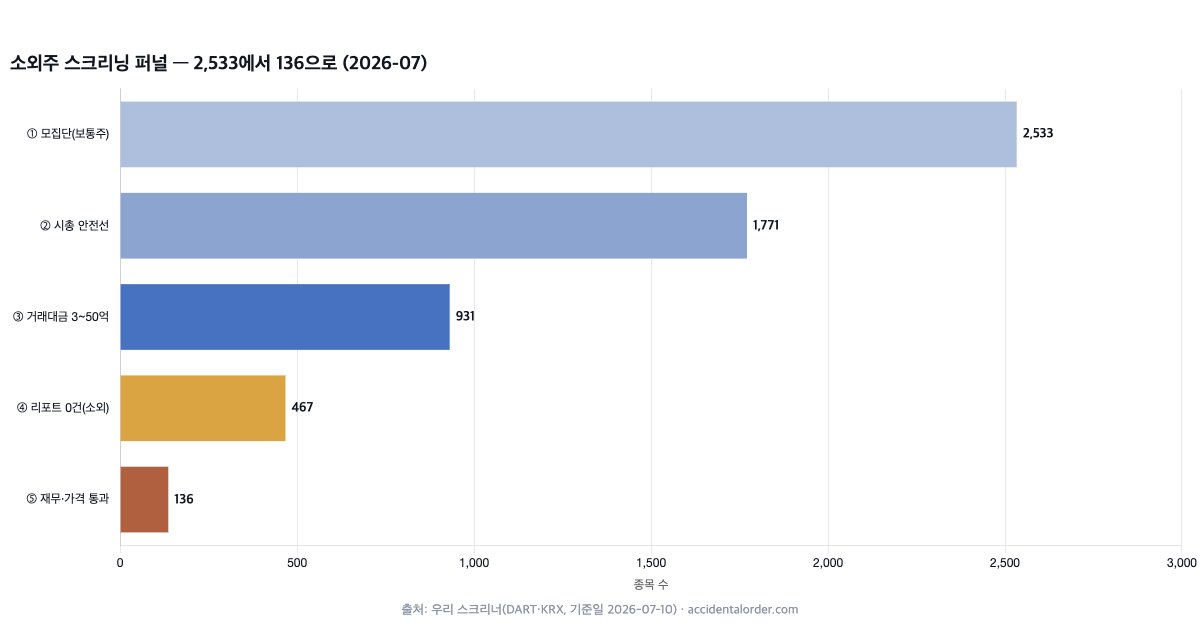
Start with why overlooked stocks arise in the first place. The funnel of the screener we use to pick stocks makes it easy to understand. Beginning from 2,533 ordinary shares listed domestically, filtering out excessively small market capitalisations leaves 1,771; narrowing to a band where daily turnover is neither too high nor too low (roughly KRW 0.3bn–5bn) leaves 931; keeping only the genuinely neglected range with zero recent brokerage reports leaves 467; and finally, those that also pass the financial and price conditions come to 136 stocks. Overlooked stocks gather at the back of this funnel, in the place where both attention and trading have thinned out.
Why stocks become overlooked
There is usually no bad reason for the neglect. The market’s spotlight simply does not reach them. First, they are too small to appear on the radar of institutions and foreign investors. Large funds have to buy and sell billions of won a day, and with a stock whose turnover is small they can neither build nor exit a position, so it drops out of consideration from the start. Second, there are no brokerage reports. Analysts mostly cover stocks that trade actively and have institutional demand, so overlooked stocks fall outside analytical coverage and disappear from public view along with it. Third, they are not included in the major indices. With no passive money flowing in to track an index, the base of demand stays thin.
These three reinforce one another. No attention means thin trading; thin trading keeps institutions out; no institutions means no reports; no reports means still less attention. The problem is that this cycle turns quite independently of the company’s earnings. There really are stocks whose prices are left neglected simply because they are small and quiet, even though they earn steadily and have sound finances. That is exactly the spot the undervaluation hunter aims for. Even so, you should also check whether there is some good reason others have looked away. And you must accept the cost of that neglect, which comes in the form of liquidity.
What liquidity is, and why it is a problem in overlooked stocks
Liquidity means the degree to which you can buy and sell the quantity you want at close to the price you want. With a stock like Samsung Electronics, where hundreds of billions of won trade each day, the price barely moves whether you buy a few million won’s worth or not, because buy and sell orders are stacked densely. An overlooked stock, by contrast, has a sparse order book. Sell quantities sit at only a few price levels, so even a modest purchase sweeps that thin supply away and the price jumps. Selling is the same in reverse: with little buying interest to absorb it, you have to lower your price before you can get filled at all. The phenomenon in which the act of trading itself pushes the price against you is called market impact, or slippage. The thinner the liquidity, the larger this impact, and the further the price moves for the same amount of money.

There are two more concrete yardsticks for measuring liquidity. One is turnover — the amount of money that actually changed hands in that stock over the day, which is trading volume (number of shares) multiplied by price. However many shares change hands, turnover can still be small if the price is low, so liquidity is more accurately viewed through turnover than through volume. The other is the bid-ask spread: the gap between the lowest ask at which you can buy right now and the highest bid at which you can sell right now. For large caps this gap is as narrow as a single tick, but for overlooked stocks it is often several ticks wide. That means the buying price and the selling price are separated from the outset, and that gap becomes your trading cost, in full.
Suppose an overlooked stock has a bid of KRW 9,800 and an ask of KRW 10,200. You can only buy at 10,200 and sell at 9,800. Even if the price does not move at all, about 4% disappears simply from buying and selling. With a large cap that round-trip cost might be less than 0.1%. This is why short-term trading is especially unfavourable in overlooked stocks: even if you call the direction correctly, the spread and slippage eat the return.
The trace this difference leaves on the chart matters. Each candle is ultimately a record of executed prices, and because executions in an overlooked stock are rare and jump in large price increments, the candles are drawn in exaggerated form. A flow that would look like a gentle curve in a large cap becomes a saw-tooth pattern lurching up and down in an overlooked stock. In the article on candlesticks and volume we noted that a candle without volume is low in reliability; in an overlooked stock, that condition is permanent.
Measured — how the chart of an overlooked stock lurches
Consider a real case. Among the stocks we analysed, Osung Advanced Materials (052420) is a KOSDAQ-listed (Korea’s growth-company market) materials company with a history as a theme stock. Looking at its market capitalisation, a market cap of about KRW 138.5bn in June 2024 jumped to KRW 238.7bn in July — more than 70% in a single month — then drifted down over time to as low as KRW 75.8bn by June 2026. On a daily-candle basis, the same trajectory shows a surge from KRW 14,040 to around KRW 19,000 within a few days, followed by a long slide back to the KRW 8,000 range. A surge like that is a textbook case of theme-driven buying landing on thin liquidity and momentarily pushing the price up, rather than of new earnings. Looking at the substance of the results, Osung’s total equity was about KRW 242.9bn and its debt ratio about 22%, so the finances are in fact fairly sound (assets 2,971 = liabilities 542 + equity 2,429), yet the share price swung sharply with liquidity and themes, unrelated to those finances.
For contrast, a stock with relatively better liquidity makes the difference plain. Cuckoo Homesys (284740) is listed on KOSPI with a market capitalisation in the KRW 400bn–600bn range, and over the same period its share price drifted gently down from KRW 30,500 to around KRW 21,400. There are ups and downs, but no stretch where it leaps 70% overnight the way Osung did. The principle shows through clearly: the thicker the liquidity, the more slowly the price reflects earnings and flows, and the thinner it is, the more violently the price lurches on even a small shock.
The trajectory of Muhak (033920), another company we analysed, is also instructive. Muhak is a regional soju producer, and its market capitalisation moved in the KRW 140bn–270bn range. On the daily candles it drifts sideways around KRW 8,000 for long stretches, then in certain periods jumps to KRW 10,400 before falling back to the KRW 7,500 range, a pattern that repeats. Rather than the smooth trend of a large cap, this is the characteristic shape of a thinly traded stock: a short jump when attention gathers, then trading drying up and the price returning to where it was once attention cools. A buyer who climbed aboard at a short-term high in a stock like this will struggle to find a counterparty during the retracement.
There is a reason our screener sets turnover as a band of roughly KRW 0.3bn–5bn rather than simply as low as possible. If turnover is too high, the market’s attention is already sufficient and the stock can hardly be called overlooked; if it is too low, you cannot buy or sell the quantity you want at all and there is no practical benefit in analysing it. A stock in which only a few tens of millions of won change hands a day cannot actually be bought, however undervalued it may be. Investing in overlooked stocks means asking not only “is the price cheap” but also “is this a size I can get into and out of”, and those two questions always travel together.
Three things to watch especially on the chart of an overlooked stock
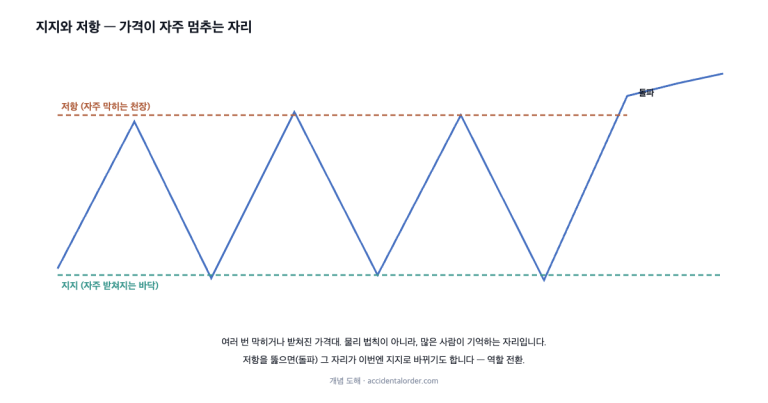
First, false breakouts. In the article on support and resistance we introduced the convention of treating a break above resistance as a buy signal; in an overlooked stock, that break may be the result of just a handful of buy orders punching through a thin order book rather than genuine demand. If that buying disappears the next day, the price is pushed straight back below the resistance line. A breakout unsupported by volume is particularly hard to trust in an overlooked stock.
Second, distortion of the indicators. In the article on RSI and MACD we noted that auxiliary indicators are constructed by calculating from the movement of price. Because the price of an overlooked stock jumps intermittently and by large amounts, RSI can leap from oversold to overbought within a day, and MACD can throw out crossover signals unrelated to any actual trend. In the Monami case we analysed, RSI(14) also swung from an extreme oversold reading to above 80 — overbought — within a few days. That is not the indicator malfunctioning; it is the result of the price lurching on thin liquidity, amplified straight into the indicator.
Third, the difficulty of exiting. Even if you read the chart well, bought well and the price rose, in an overlooked stock the moment of selling is the real test. When you put your holding up for sale during a rising phase, the bids available to absorb it are thin, the price gives way, and you end up disposing of it at a price below the one displayed on the screen. That gap between paper profit and realised profit is the core of the liquidity trap in overlooked stocks. Because you pay slippage on both the buy and the sell side, the round-trip trading cost is far larger than for a large cap.
How fearsome slippage and the spread can be becomes clear during a retracement. While the price is rising, buying pushes it up and the number on the screen looks good; but when the mood cools and more people want to sell, the thin bids empty out in an instant and the price steps down like a staircase. That is why a decline that would be a gentle correction in a large cap appears as a plunge in an overlooked stock. In other words, liquidity exaggerates the price on the way up and accelerates the loss on the way down. Understanding this asymmetry explains why, in overlooked stocks, “taking a profit is hard and cutting a loss is painful”.
So should overlooked stocks be avoided
No. The very fact of being overlooked can be the source of undervaluation, and that is why The Accidental Order goes to the trouble of digging through overlooked stocks. But the tools you approach them with must be different. An overlooked stock is not something to buy and sell on short-term chart signals; it is closer to something whose corporate reality you confirm through the financial statements and then hold for a sufficient period. Here the chart is only a secondary reference for entry and exit, and it is hard to make it the main basis for judgement. Asking first whether the quantity you want to buy is excessive relative to daily turnover, and whether it is a size you can sell out of when you want to, matters more than any candlestick pattern.
One misconception is worth addressing here. “Overlooked stocks are risky, so avoid them entirely” and “you make big money by buying when nobody else knows” are both only half right. Precisely, the risk of an overlooked stock lies not in the stock itself but in the size of your trade and your holding period. For an investor taking only a tiny fraction of daily turnover with a horizon of several years, the liquidity trap is broadly a manageable cost. For an investor trying to turn over a large sum in the short term, it is fatal. Even for the same stock, whether it becomes a trap or an opportunity depends on who is approaching it and how.
A practical check — questions to ask when you meet an overlooked stock
There are things to confirm before you even open the chart. First, what is the average daily turnover? Work out what percentage of that figure the amount you intend to buy represents, and it becomes immediately clear whether you are large enough to move the price. Second, how wide is the bid-ask spread? If the gap between bid and ask is more than 1%, you need to accept the round-trip cost in advance. Third, did the recent surge or drop come from a change in earnings, or from flows on top of thin liquidity? Cross-check against DART (Korea’s mandatory electronic disclosure system) filings: if it is a surge with no earnings basis, that price can retrace at any time.
All of these questions point at the company and the trading structure rather than at the chart. In overlooked stocks the chart is more likely to mislead than to answer, so it is safer to put the centre of gravity of your judgement on financials and liquidity. The chart is most useful when used as a secondary tool to check a judgement you have already made — for instance, to confirm a long period of base-building in the price, or conversely to stay wary of the retracement after a surge unrelated to earnings.
What this article does not say
“Volume is low, so it must be a manipulator’s stock about to surge” — a baseless piece of folklore. Low volume is simply the fact that there is no attention; it foretells no rise. If anything, thin liquidity means there is no buying to absorb a fall either, so it can collapse more steeply.
“A surge on the chart of an overlooked stock is a sign of accumulation” — an interpretation that cannot be verified. In a thin order book even a small purchase can create a surge, so reading the surge itself as the intent of a particular party is over-interpretation.
“Rising turnover always means a trend reversal” — this cannot be asserted. It may be a temporary inflow of theme money, or existing holders liquidating. An increase in turnover is an observed fact, not evidence of direction.
Frequently asked questions
Q1. Below what level of daily turnover should a stock be regarded as overlooked?
There is no absolute standard. That said, once the amount you intend to trade exceeds a portion of daily turnover (say, more than 1–5%), it means you yourself are large enough to move the price, and you should be acutely aware of the liquidity trap. Our screener treats roughly the KRW 0.3bn–5bn range as the overlooked candidate zone.
Q2. Can I avoid slippage in an overlooked stock by trading only with limit orders?
A limit order prevents you being filled at a price you did not want, but in exchange you take on the risk of not being filled at all. In a thin order book there may be no counterparty at your price, and the order can sit unfilled for days. Slippage and non-execution are the two risks you trade off against each other when liquidity is thin.
Q3. Do moving averages or RSI mean anything in overlooked stocks?
Only to a limited extent. If the price jumps intermittently the indicators jump too, so they are hard to use as short-term signals. It is still possible to take a rough view of direction from a perspective that filters out most of the noise, such as a long moving average of several months or more. Using indicators as precise timing tools for trading is not recommended.
One further point: when observing an overlooked stock, it helps to build the habit of stretching out the chart’s time axis. Daily candles over a day or two lurch badly on thin executions, but viewed on weekly or monthly candles across several months the noise is filtered out and it becomes visible where the price lingered for long periods and what triggered a break away from it. In overlooked stocks, short-term candles are closer to noise, and the big picture on a long time axis is the closest thing to a signal. This chimes with the principle of filtering noise to see direction that we covered earlier in trends and moving averages.
Two tracks become one — the conclusion of this series
This is the last article of the technical analysis track. And the study we have pursued along two branches, fundamental and technical, converges in overlooked stocks. The lesson from overlooked stocks comes to this: the financial statements tell you the value of a company, and liquidity tells you whether that value can actually be bought and sold. The chart only shows the trajectory of the price between the two; it does not judge value or liquidity on your behalf.
That is why order matters. First confirm through the financial statements whether the company genuinely earns money; next check through turnover and the order book whether there is enough liquidity to bear the size you want; and only at the end bring in the chart as a reference for entry and exit. Invert that order and chase short-term chart signals first, and in overlooked stocks especially you walk straight into the liquidity trap. Buying a good company cheaply, and only as much of it as you can actually take on — everything the two tracks of study point to converges into that one sentence.
Q4. Does scaling in and scaling out help with overlooked stocks?
Yes. Putting a large quantity in at once pushes the price up and makes you buy expensively, so spreading purchases over several days reduces market impact. The same applies when selling. The trade-off is that dividing it up takes time, and you have to accept that the price may change in the meantime. In overlooked stocks the principle is not “quickly” but “slowly, in a size you can handle”.
※ This article does not recommend the purchase or sale of any particular security; investment decisions and their consequences are the responsibility of the investor. Figures are cited from public sources such as DART and KRX as at the reference date, and may have changed since.