The Traps of PER and PBR: Is What Looks Cheap Really Cheap?
PER and PBR are the most widely used valuation multiples. They are tools for asking, in a single number, “is this company cheap or expensive?” Beginners pick them up quickly and use them readily. The problem is that they are also the multiples that are most frequently misused. Simple readings such as “the PER is low, so it is cheap” or “the PBR is below 1x, so it is undervalued” sound plausible but often turn into traps. This article sets out precisely what PER and PBR measure, and what traps hide behind those low and high numbers, with real figures alongside.

PER — how many times earnings is the price?
PER (the price-earnings ratio) is market capitalisation divided by net profit (or the share price divided by earnings per share). It means “at how many times its annual earnings is this company trading?” A PER of 10x means that, buying the whole company at the current price, you would recover your outlay from ten years of earnings (assuming earnings stay the same). The lower the PER, therefore, the cheaper the company looks relative to its earnings.
But the denominator of PER, net profit, wobbles because — as we learned earlier — one-off items and financial gains and losses are mixed into it. PER is therefore highly sensitive to which year’s net profit was used in the calculation. In particular, calculating it from the net profit of a peak-earnings year produces a low PER and a cheap appearance; but once those earnings come back down to a normal level, the PER rises again. This is the first trap.
PBR — how many times net assets is the price?
PBR (the price-book ratio) is market capitalisation divided by shareholders’ equity (net assets). It means “at how many times its book net assets is this company trading?” A PBR of 1x means market capitalisation equals net assets; below 1x means you can buy the company for less than its net assets. A PBR below 1x is therefore commonly read as a sign of undervaluation — “cheaper than liquidation value.”
There is a trap here too. As we saw in the earlier article on the balance sheet, an asset’s book value and its real value can differ. If the assets are cash and prime real estate, a PBR of 0.5x really is undervaluation; but if they are unsellable inventory or impaired goodwill, the book net assets themselves may be a fiction. In other words, a low PBR only tells you it is “cheap relative to the book” — whether that book can be trusted is a separate question.
Real figures — the PER and PBR of our stocks
Looking at the PBR and PER of the stocks we have analysed together reveals the terrain of valuation (based on 2024 financials and July 2026 market capitalisation).
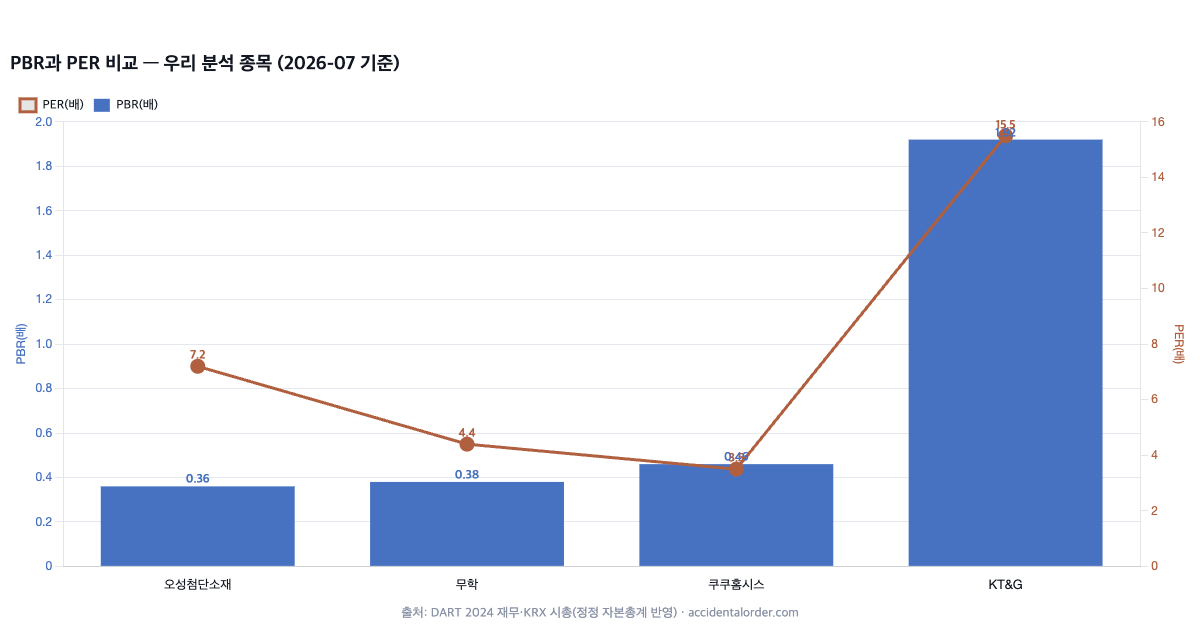
Osung Advanced Materials (PBR 0.36), Muhak (0.38) and Cuckoo Homesys (0.46) all trade well below their net assets, and only KT&G (1.92) trades at roughly twice net assets. On PER too, Cuckoo Homesys (3.5) and Muhak (4.4) are low while KT&G (15.5) is high. Read only on the surface, it is easy to conclude that “Muhak, Cuckoo and Osung are cheap and KT&G is expensive.” But this is precisely the entrance to the trap. Only by looking at the story behind each low number can you tell whether it is genuine undervaluation.
Muhak’s low PBR comes from a thick cushion of cash and financial assets, so the quality of the assets is relatively high — this is closer to genuine asset-play undervaluation. Cuckoo Homesys’s low PBR and PER, taking its stable rental earnings into account, leave room to see it as an overlooked quality company. Osung’s low PBR and PER in the 7x range, by contrast, may belong on the “cheap for a reason” side: it is uncertain whether the 2024 earnings surge will continue, and there is a history of frequent capital raises and convertible bonds increasing the share count. Even the same low PBR can differ this much in character.
Trap 1 — peak earnings behind a low PER
The most common trap arises with cyclicals. Companies heavily exposed to their industry cycle — semiconductors, chemicals, shipping — see earnings explode at the peak of a boom, printing a very low PER. Buy at that moment, crying “PER of 3x, extremely undervalued!”, and the cycle soon turns, earnings collapse, and the PER suddenly leaps into the tens. Paradoxically, such companies are often at their most dangerous when the PER is low, and at their most opportune when the PER is high or they are loss-making (the bottom of the cycle). Whenever you see a low PER, you must ask: are these earnings at a normal level, or at a peak?
Trap 2 — the value trap behind a low PBR
Some companies stay at a low PBR year after year. This is the so-called value trap. The book net assets are large, but those assets earn nothing (a low ROE), or they simply pile up instead of being returned to shareholders, or the controlling shareholder is indifferent to minority shareholders’ interests. Such companies remain in a state of “looking cheap and staying cheap,” because there is nothing to resolve the reason for the cheapness.
So when looking at a low PBR you must also look at ROE. If PBR is low and ROE is low too, this may be a company that “has plenty of assets but cannot make money with them.” Conversely, if PBR is low while ROE is decent and shareholder returns are beginning, there may be room for the undervaluation to be resolved — a genuine opportunity. The key is not the low PBR itself but whether there is a reason for that low PBR to be resolved.
Trap 3 — a high PER or PBR is not always expensive
There is a trap in the opposite direction as well. A high PER or PBR does not automatically mean expensive. A company that sustains high profitability (ROE) over a long period while growing quickly can justify a high PER and PBR, because you cannot buy a company that will earn far more in future at a low multiple of today’s earnings. KT&G’s PBR of 1.9x and PER of 15x, likewise, are hard to call unconditionally expensive once its stable cash generation and dividends are taken into account.
Rejecting growth companies as “expensive” on PER alone can therefore mean missing good businesses, while buying a company whose growth has stopped purely on a low PER means walking into a trap. PER and PBR are not absolute standards but relative measures that must be interpreted in the light of that company’s growth and profitability.
Trailing PER and forward PER
There are two kinds of PER depending on which earnings you use. Trailing PER is calculated from already-reported net profit for the past twelve months (or last year), while forward PER is calculated from expected net profit for this year or next. A growing company shows a forward PER lower than its trailing one; a company whose earnings are about to turn down shows the reverse.
Knowing the difference matters for a reason. Whichever version a brokerage or a portal displays changes the impression you form. Forward PER in particular rests on “expected” earnings, so if the expectation misses, the whole thing collapses. To avoid being fooled by a low forward PER built on optimistic estimates, check whether the estimate is realistic and how far it has diverged from trailing (actually reported) earnings.
PBR, liquidation value and the moat
When a PBR below 1x is described as “cheaper than liquidation value,” what it strictly means is “cheaper than book net assets.” Actual liquidation value is what the assets fetch in a hurried sale, which can be lower than book value; conversely, some assets — long-held real estate, say — have a market value far above book. Equating PBR directly with liquidation value therefore calls for caution.
At the opposite extreme are companies with a very high PBR: brands, software and platforms, which hold few assets yet generate large profits. Their real value lies in intangible strengths absent from the books — the moat formed by brand, network effects and switching costs. This force, which the balance sheet does not capture, is what justifies a high PBR. So before rejecting a company for a high PBR or welcoming one for a low PBR, ask whether this company’s value sits inside the books or outside them.
PSR, EV and other multiples
There are alternatives for when earnings are negative or too erratic for PER to mean anything. PSR (the price-sales ratio) is market capitalisation divided by revenue, and is used for early-stage growth companies that are not yet profitable. It carries the risk of overvaluing companies with large revenue and no profit, so it needs care. EV/EBITDA, which also accounts for debt and cash, is covered properly in the next article. No single measure is universal; the principle is to pick the ones that suit the character of the company and look from several angles.
The denominators of these multiples — earnings, assets, revenue — all come from the financial statements we have already studied. Profit from the income statement, equity from the balance sheet, and whether that profit is real is verified with the cash flow statement. Valuation multiples are built on top of the financial statements, so if you cannot read the statements you will misread the multiples too.
PER, PBR and ROE are linked as one
These three measures are in fact connected mathematically. The relationship PBR = PER × ROE holds. So if “a company generating a high ROE trades at a low PBR,” that in itself is a sign of undervaluation, while “a low ROE with a high PBR” may indicate overvaluation. Rather than looking at PBR alone or PER alone, viewing them as a triangle together with ROE is how to read valuation in three dimensions. The profitability measures learned earlier meet valuation here.
Relative comparison — against what?
There is no correct absolute value for PER or PBR. They are therefore always compared against three things. First, peers in the same industry. Comparing a bank’s PBR side by side with a biotech’s is meaningless. Second, the company’s own history. Look at where the current PER sits within the company’s historical range. Third, the growth rate. Fast growth suits a high PER, slow growth a low one. Measures such as PEG, which divides PER by the earnings growth rate, are used in this context. A PER or PBR figure standing alone tells you nothing.
The PER of the whole market — beyond individual stocks
PER applies not only to individual stocks but to the market as a whole. Dividing the total market capitalisation of the KOSPI (the main board of the Korean stock market) by the sum of listed companies’ net profit gives the “market PER.” When this value is far above its historical average it is read as a phase in which the market overall is expensive, and when it is below, as a cheap phase. The so-called “Korea discount” — the fact that the Korean market trades at lower PER and PBR than other countries — also comes out of this market-level comparison.
Comparing an individual stock’s PER with the market average adds context. If the market PER is 10x and a stock trades at 5x, that means half the market’s price, and you can then examine whether the discount is justified (because the business is weak, or because the stock is overlooked). The market PER also swings with the earnings cycle, of course, so it is no absolute standard — but it is useful for forming the big picture of whether the market as a whole is currently cheap or expensive.
Turn PER upside down — the earnings yield
The reciprocal of PER (1÷PER) is called the earnings yield. A PER of 10x is an earnings yield of 10%, a PER of 20x is 5%. Inverted like this, equities can be compared with bonds in terms of “yield.” Set a stock with an 8% earnings yield against a deposit or bond paying 4%, for instance, and you can gauge whether the stock offers enough extra return for the risk taken.
This perspective also explains why the interest rate environment matters so much to valuation. When rates rise, safe bond yields rise with them, so equities need a correspondingly higher earnings yield (that is, a lower PER) to be attractive. That is why high-PER growth stocks are hit particularly hard in a rising-rate phase. Inverting PER into an earnings yield makes visible that share prices sit inside the larger context of interest rates.
A checklist for reading PER and PBR
- Which earnings or equity was used: trailing or forward, consolidated or controlling-interest equity.
- Find the reason for the low number: peak earnings, impaired assets, or simply being overlooked?
- Read it with ROE: PBR = PER × ROE. A low PBR with a decent ROE is the real opportunity.
- Compare with peers, history and growth: a number standing alone is meaningless.
- Is there a trigger for resolution: is there a visible reason for the undervaluation to unwind?
Here is one practical habit worth adopting. When you see a low PER or PBR on some stock, instead of immediately concluding “it is cheap,” write down on paper: “why is this cheap?” Because earnings are at a peak, because the assets are impaired, because growth has stopped, or simply because it is overlooked — you should be able to write down at least one reason. And if you also write down whether that reason could change in future, the outline of whether the undervaluation is a trap or an opportunity comes into focus. The habit of writing this one line prevents the mistake of buying, mesmerised by a cheap number.
The moment undervaluation unwinds — the catalyst
When a low PER or PBR that has been ignored for a long time finally unwinds, there is usually a catalyst: the start of shareholder returns such as a bigger dividend or a share buyback and cancellation, an improvement in governance, the disposal of a failing business, an earnings turnaround. When such a catalyst appears, the very things that had been the reason for the undervaluation come undone and the market begins to re-rate the stock.
So when looking at an undervalued stock, do not stop at “it is cheap”; go on to ask “what could unwind this undervaluation?” Undervaluation with no visible catalyst can persist for years (the value trap). Undervaluation with a catalyst in sight, on the other hand, can reward the wait. The reason we frame the core thesis in our stock analyses in the form of a catalyst — “is the net cash starting to be transferred into dividends and buybacks?” — is precisely to confirm over time whether the undervaluation is being resolved.
In the end, PER and PBR are only the starting point for measuring “how cheap it is”; the investment judgement is completed by “why it is cheap” and “when that reason will unwind.” Skipping these two questions and buying purely on a low number is the trap this article has warned against from the outset.
Frequently asked questions (FAQ)
Q1. If the PER is low, is it fine to buy?
A low PER is a starting point, not a conclusion. You need to check whether those earnings are at a normal level (rather than a peak) and whether they will be sustained. For cyclicals, a low PER can in fact be the dangerous moment. Find the “reason” for the low PER first.
Q2. Does a PBR below 1x automatically mean undervaluation?
No. It depends on the quality of the assets, on ROE, and on whether shareholder returns are happening. With plenty of quality assets and returns being made, it is genuine undervaluation; with impaired assets or no profitability and no returns, it may be a value trap that stays cheap indefinitely.
Q3. How do you look at PER for a loss-making company?
If net profit is negative, PER either cannot be calculated or is meaningless. In such cases you use alternatives such as PBR, PSR (against revenue), or the EV/EBITDA covered in the next article. When one measure does not work, you need the flexibility to look from another angle.
Valuation is not an exact science
Finally, a question of attitude. Calculating PER and PBR to the decimal place looks precise, but those numbers ultimately swing a great deal with estimates and timing. The value changes depending on which year’s earnings you use and at what date you take market capitalisation. Valuation is therefore not a search for the correct answer, of the form “a PER of exactly 8.3x is fair for this company,” but the work of gauging “is this roughly cheap or roughly expensive, and if so, why?”
Rather than clinging to a single number, it is better to form the big picture by looking across several measures, several years and several angles. And whenever you meet a company that looks undervalued, always ask first: “why is the market leaving this cheap?” Most undervaluation has a reason, and the real opportunity is when a trigger for that reason to unwind comes into view. The reason we set out a core scenario for a stock and report on it quarterly in our stock tracking is likewise to verify, over time, whether that “reason” holds.
Summary
PER is price against earnings; PBR is price against assets. Neither is unconditionally cheap when low, nor unconditionally expensive when high. Behind a low PER may hide peak earnings; behind a low PBR, impaired assets or an undervaluation that never unwinds (the value trap). Conversely, a high multiple can be justified by high profitability and growth. PER and PBR must therefore be interpreted together with ROE, and against peers, the company’s own history and its growth rate. The next article covers EV/EBITDA, which accounts for the debt and cash that market capitalisation alone misses, and DCF, which estimates value by discounting a company’s future cash flows to the present. These are valuation tools one step further in, complementing the limits of PER and PBR.
Investing fundamentals · fundamental analysis. This article is for information only and is not a recommendation to buy or sell any particular security. Figures are based on public data from DART and KRX and may have changed since the time of writing (July 2026).