How to Read a Cash Flow Statement: The True Face of Profit and the Scent of Window Dressing
The cash flow statement is called the most honest of the three financial statements. Profit on the income statement is a number in which accounting rules and estimates are mixed, whereas cash is money that actually entered and left the bank account and is therefore relatively hard to manipulate. So the cash flow statement is the final checkpoint for the question “they say a profit was made, but is it real?” This article takes apart the three activities of the cash flow statement and uses real company figures to show why, and by how much, profit and cash differ — and how to catch what is known as the scent of window dressing.
Why profit and cash differ
The starting point is the fact that “profit ≠ cash.” Accounting uses accrual accounting: the principle that revenue and expenses are recognised at the point the transaction occurs, not at the point money actually changes hands. So goods handed over but not yet paid for are still booked as revenue and profit (with a trade receivable created instead), and expenses such as depreciation, where no cash actually leaves, still reduce profit.
Thanks to accrual accounting the income statement shows a period’s operating performance well, but it can diverge from “how much cash actually came in and went out.” The cash flow statement fills that gap. Starting from profit calculated on an accrual basis, it strips out the items where no cash moved and leaves only what actually moved, showing the company’s true cash position. The cash flow statement divides cash movements by their character into three activities: operating, investing and financing.
Operating cash flow — the cash the core business made
The most important is operating cash flow: the cash actually earned by running the core business, the underlying fitness that sustains a company’s survival and growth. Most companies present it using the indirect method. It starts from net profit, adds back expenses where no cash left (depreciation and the like), subtracts income where no cash came in (valuation gains on financial assets and the like), and adjusts for changes in working capital (movements in receivables, inventories and payables) to arrive at the actual cash figure.
Operating cash flow therefore reveals the “quality” of net profit. At a healthy company, operating cash flow is steadily positive at a level similar to, or above, net profit. Conversely, if profits are made but operating cash flow stays negative or comes in far below net profit, that profit may be tied up in receivables and inventories or inflated by non-cash items. Whenever profit and cash point in different directions, the reason must be examined.
Investing cash flow — spending for the future
Investing cash flow is the cash a company spends on, or recovers from, its future. Buying plant and equipment sends cash out (capital expenditure, capex); selling assets or financial assets brings cash in. A growing company usually shows negative investing cash flow because of capital spending. That is not a bad thing — it means money is being planted for the future.
An important concept here is free cash flow (FCF). It is operating cash flow less capital expenditure (capex) — the “genuine spare money” left over after maintaining the core business. This money can fund dividends, buybacks and debt repayment. A company with consistently thick FCF has ample capacity for shareholder returns, while a company with persistently negative FCF must rely on outside funding (borrowing, share issues) to grow.
Financing cash flow — raising and returning
Financing cash flow is cash raised, or returned to shareholders and creditors. Taking on debt (borrowing, issuing bonds) is positive, repaying it is negative. A rights issue is positive; paying a dividend or buying back shares is negative. So the sign and the detail of financing cash flow tell you whether the company is in a “pulling money in” phase or a “returning money to shareholders” phase.
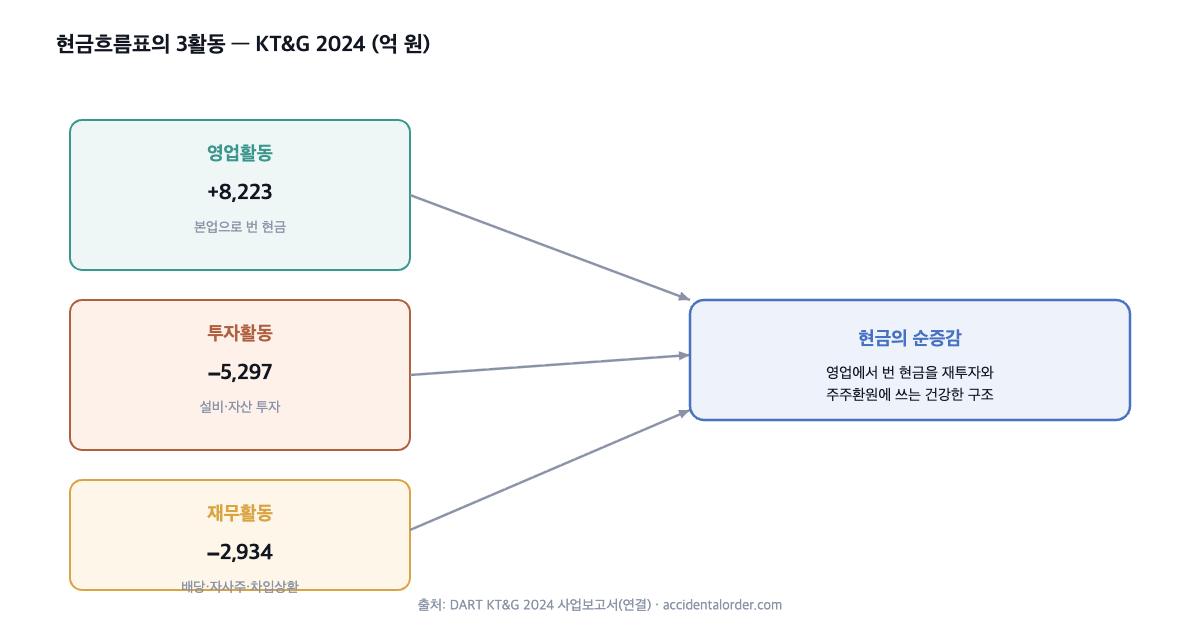
The typical picture at a mature, high-quality company looks like this. It earns plenty of cash from operations (+), reinvests part of it in plant (investing −), and uses what is left for dividends, buybacks and debt repayment (financing −). KT&G, in the diagram above, is exactly that picture. In 2024 it earned KRW 822.3bn from operating activities, spent KRW 529.7bn on investing activities, and sent out KRW 293.4bn through financing activities (dividends, buybacks and debt repayment). It is a textbook healthy structure, circulating the cash the core business generates into reinvestment and shareholder returns.
Reading a company from the combination of the three activities
The combination of signs across the three activities alone reveals what phase a company is in. Operating (+), investing (−), financing (−) is the archetype of a mature, high-quality business, like KT&G above. Operating (+), investing (−), financing (+) may be a growth phase in which the company earns while also pulling in more money through debt and share issues to invest aggressively. Conversely, a sustained pattern of operating (−), financing (+) is a warning signal: the company cannot generate cash from its core business and is being held up by outside funding, so it is in danger once that funding dries up. The combination of signs reveals a company’s “funding phase,” something the single profit line on the income statement cannot tell you.
Real figures — the gap between profit and cash (Muhak vs Osung)
Here is how profit and cash diverge, using the actual 2024 figures of two companies we have analysed.
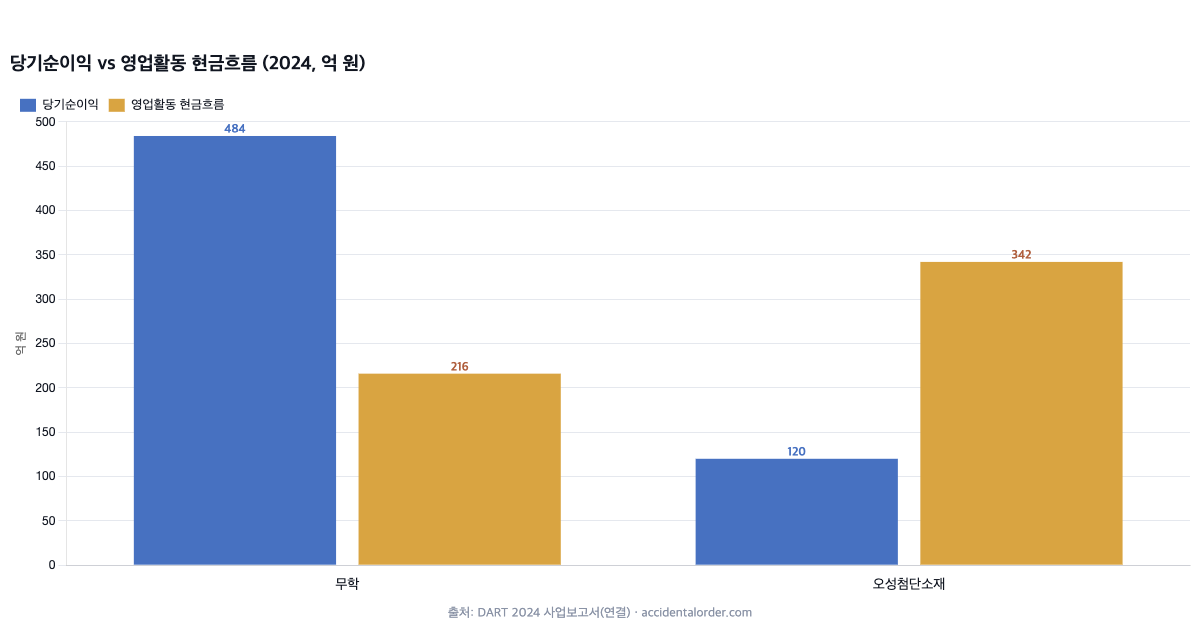
Muhak reported net profit of KRW 48.4bn against operating cash flow of KRW 21.6bn — profit larger than cash. Why? A considerable amount of valuation and disposal gains on financial assets held is mixed into Muhak’s net profit, and such financial gains and losses are recorded under investing activities rather than as cash from the core business (operating activities). Indeed, Muhak’s 2024 investing cash flow was +KRW 209.0bn, with large sums coming in from selling financial assets. In other words, a substantial part of that “KRW 48.4bn of net profit” came from investment assets rather than from the core business, which is why operating cash flow (KRW 21.6bn) is smaller. This structure connects precisely with the question of “the quality of net cash” covered in the Muhak stock analysis.
Osung Advanced Materials, by contrast, reported net profit of KRW 12.0bn against operating cash flow of KRW 34.2bn — cash larger than profit. This may be the result of non-cash expenses such as depreciation cutting profit while no cash actually left, or of an improvement in working capital bringing cash in. In general, operating cash flow that is larger than net profit and stable is read as a signal of good earnings quality. But it should not be judged from a single year; it must be confirmed across the trend of several years.
The scent of window dressing — what to suspect
Accounting fraud (window dressing) generally runs in the direction of inflating profit, and it leaves its traces on the cash flow statement. The commonest signal is profit that keeps rising while operating cash flow fails to follow, or stays negative, for a sustained period. When revenue and profit are inflated on the books (through fictitious sales and the like), no matching cash arrives, so trade receivables alone swell abnormally and operating cash flow diverges from profit.
So practitioners look at net profit and operating cash flow side by side over several years. If the gap between the two keeps widening, or if profit is positive while operating cash flow is chronically negative, they become strongly suspicious. Of course there are plenty of legitimate reasons for a gap (financial gains and losses, as at Muhak, or rising working capital during a growth phase), so a gap is not fraud in itself. The key question is “can the cause of the gap be explained?” A persistent divergence that cannot be explained — that is the scent of window dressing. The cause is checked against receivables and inventories on the balance sheet and in the notes.
Direct and indirect methods — the same cash, presented differently
There are two ways of presenting operating cash flow. The direct method lists actual cash items directly — cash received from customers, cash paid to suppliers. It is intuitive but cumbersome to prepare, and so rare in practice. The indirect method starts from net profit and works back to cash by adjusting for non-cash items and changes in working capital. Most companies use the indirect method, and the cash flow statements we see are generally indirect.
There is a reason the indirect method is actually more useful to investors. The very process of stepping down from net profit to operating cash flow shows, item by item, “why net profit and cash differ.” How much depreciation was added back, how much receivables grew and ate into cash, how much inventory piled up — all of it is written out in those adjustment lines. Reading the adjustment items in an indirect-method cash flow statement therefore lets you pinpoint immediately what is shaking the quality of profit.
The cash flow statement and the source of shareholder returns
The source of dividends and buybacks is, in the end, the cash the company actually earned. However large the book profit, a dividend cannot be sustained if that profit does not arrive as cash. So in assessing the sustainability of a dividend, look at the ratio of dividends to free cash flow (FCF) rather than to net profit. If FCF comfortably covers the dividend, that dividend is stable; if the dividend exceeds FCF, it is being paid out of debt or by breaking into assets, and is hard to sustain.
This perspective connects with compounding as well. When the virtuous circle of a company reinvesting the cash it earns to generate cash again continues over a long period, the power of compounding works inside the company. Conversely, if only the book profit is large and cash does not follow, that profit cannot become a seed for compounding. The cash flow statement sorts out “is this company’s profit a seed that will bear future cash, or a number on a page?”
Why cash is relatively honest
The reason the cash flow statement is called “the most honest statement” is that movements of cash are backed by bank records and so are harder to manipulate than pure accounting estimates. Earnings management by inflating revenue or deferring costs is possible on the income statement, but if no cash actually arrives it is not reflected in operating cash flow. Simply setting profit against cash can therefore filter out a good many cases of profit inflation.
The cash flow statement is not perfect either, however. Management judgement can enter into which of the three activities a given cash movement is classified under, and that classification is sometimes used to make operating cash flow look better — for instance by pushing spending that is essentially operating into investing activities to inflate operating cash flow. So do not look at the single operating cash flow line alone; look at all three activities and their classification together. Even “the honest statement” must not be trusted blindly.
Heavy depreciation widens the gap between profit and cash
The cash flow statement matters especially when looking at companies with heavy capital spending (manufacturing, telecoms, rentals), because such companies carry large depreciation charges. Depreciation reduces profit as an expense on the income statement, but no cash actually leaves, so it is added back to net profit in arriving at operating cash flow. A company with heavy depreciation can therefore show a small-looking net profit alongside a much larger operating cash flow.
There is a trap here, though. Even if adding back depreciation makes operating cash look large, that equipment will one day have to be replaced. Depreciation is, in effect, “advance notice of cash that will go out again in future.” A company with heavy depreciation cannot rest easy on operating cash flow alone; you must look alongside at how much goes out each year in replacement capex and whether free cash flow is still left afterwards. It is the same reason EBITDA (earnings before depreciation and amortisation) risks overstating cash-generating power, which is dealt with in the article on EV/EBITDA.
Seasonality and quarterly cash flow
Cash flow swings with seasonality far more than profit does. Depending on the timing of collections and payments, year-end bonuses, tax payments and inventory building, cash piles into or drains out of particular quarters. Concluding from a single quarter’s cash flow that “this company is running out of cash” is therefore an easy misreading. Cash flow has to be read over at least a year (annually), and ideally across several years in sequence, before the real trend appears. Looking at the sum of the most recent four quarters (annualised) in particular cancels out the seasonality and sharpens the picture.
Reading a crisis early from the cash flow statement
Many corporate crises signal themselves on the cash flow statement before the income statement. When profit is positive but operating cash flow deteriorates, and the hole is plugged with financing activities (borrowing, share issues) for several quarters running, the company is slowly being pushed towards a funding squeeze. An investor watching only profit misses the crisis; an investor watching cash flow prepares in advance. This is exactly why the expression “insolvency in the black” exists. Companies fail not because of losses but when cash dries up, and that drying is recorded first on the cash flow statement.
Accruals — the difference between profit and cash itself
Net profit less operating cash flow is called accruals. It is the size of “profit not backed by cash.” Small accruals mean most of the profit arrived as cash; large accruals mean the profit is leaning on non-cash items such as receivables, inventories and valuation gains.
Something has long been observed in academia and in practice: the share-price performance of companies with large accruals (a lot of profit not backed by cash) tends to be weaker afterwards than that of companies with small accruals. The interpretation is that low-quality profit is eventually reversed. This is of course a statistical tendency rather than a law governing any individual stock, and there are plenty of legitimate reasons for large accruals (working capital in a growth phase, financial gains and losses as at Muhak). Even so, habitually checking “the gap between net profit and operating cash flow” is one of the most practical tools available for gauging the quality of profit.
The order in which to read a cash flow statement — a five-minute checklist
- Operating cash flow: is it steadily positive (does the core business earn cash)?
- Net profit vs operating cash flow: are the direction and size similar, and if the gap is large, what causes it?
- Free cash flow (FCF): is operating cash less capex positive (capacity for shareholder returns)?
- The combination of signs across the three activities: which phase is the company in (mature, growth, warning)?
- The detail of financing activities: is it pulling money in, or returning it to shareholders?
One habit is worth adopting. Whenever you look at a company, always write operating cash flow next to net profit on the income statement. If the two numbers move in step over several years, the profit can be trusted; if they keep diverging, the reason has to be dug into. That single line of comparison is the simplest yet most powerful line of defence against being swept along by a dazzling earnings announcement.
Frequently asked questions (FAQ)
Q1. Is negative operating cash flow always bad?
It is generally a warning signal, but there are exceptions. A fast-growing early-stage company can be temporarily negative because cash is tied up in receivables and inventories. The key is persistence. Several consecutive years of negative operating cash flow sustained by outside funding is dangerous.
Q2. If cash matters more than profit, can I skip the income statement?
No. The three must be read together. The income statement shows the size of performance and the margins, the cash flow statement shows the quality of that profit, and the balance sheet shows stability and asset quality. The cash flow statement alone cannot tell you a company’s profitability or its asset structure.
Q3. How is free cash flow (FCF) calculated?
At its simplest, subtract capital expenditure (capex — acquisitions of tangible assets within investing activities) from operating cash flow. It is the cash a company has left over after maintaining its core business, and the source of dividends, buybacks and debt repayment. It is also the starting point for a DCF valuation, dealt with in this track’s articles on EV/EBITDA and DCF.
How the cash flow statement connects to investing fundamentals
The cash flow statement connects with the basic fitness of an investment as well. A company that steadily generates cash from its core business has a strong capacity to endure bad periods. This is the corporate version of “how shallowly you pass through the worst stretch,” covered in investment risk. A company with weak cash generation is shaken hard by a funding squeeze in a downturn, while a cash-rich company can turn the crisis into an opportunity. Reading an individual company’s cash flow, and working out how to combine such companies to lower portfolio risk, are questions that have to travel together.
In summary
The cash flow statement is where you verify whether profit is real cash. Operating activities show the cash the core business earned, investing activities the spending for the future, and financing activities the raising and returning of funds. Setting net profit beside operating cash flow and asking the cause of any divergence is the heart of judging the quality of profit, and a persistent divergence that cannot be explained is the scent of window dressing. That completes our pass through all three financial statements. The next article deals with the distinction that always accompanies these three — why consolidated and separate financial statements differ, and which of them to look at.
Investing study · fundamental analysis. This article is for information only and is not a recommendation to buy or sell any particular stock. Figures follow the original DART filings and may change after the time of writing (July 2026).