Technical analysis, from the ground up — a six-part learning roadmap
This article is both a table of contents and a study guide that threads together the six-part technical analysis series published by The Accidental Order. If you are opening a chart for the first time, it is easy to feel lost in front of candles, moving averages and a crowd of indicators, with no idea what to look at first. This page sets out what each article covers and in what order it is best learned, and above all it explains the attitude with which technical analysis should be approached. One thing needs stating clearly up front. Technical analysis is not fortune-telling that predicts the future; it is a tool that organises observable facts — price and volume — to support probabilistic judgement. Miss that premise and you can memorise any number of patterns and still end up closer to gambling. Keep it, and the chart becomes a dependable reference for managing risk and refining execution.
How to approach technical analysis
Few fields are as widely misunderstood as technical analysis. On one side is the overconfidence that the chart alone can tell you where the price will go; on the other, the dismissal that all of it is superstition. Our position sits between the two. Price and volume are the record left behind by the actual behaviour of market participants, so organising them systematically produces information that can tilt the odds slightly in your favour. But that information is always probabilistic and guarantees no individual outcome. This track teaches the limits of a signal as much as the signal itself.
So the right attitude in learning technical analysis is not “when this pattern appears, the price rises” but “under these conditions this has happened relatively often, so I take it as a reference while managing risk”. Reading charts in the language of probability and risk management rather than prediction — that is what this roadmap aims at. Absorb this single perspective and you gain a firm centre that does not wobble amid the market’s noise.
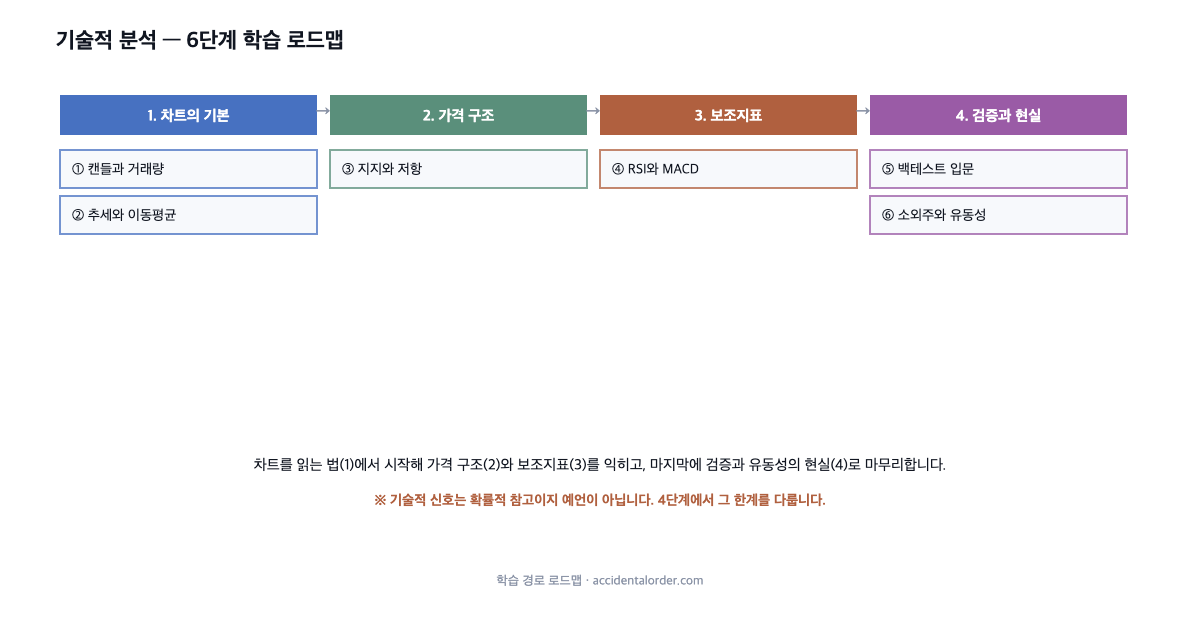
Stage 1 — chart basics: reading price and volume
Every chart is made of two facts: how the price moved, and how much was traded. In Candlesticks and volume you learn to read the four values held in a single candle (open, high, low and close) and the volume that determines how much that candle can be trusted. Then in Trend and moving averages you learn the principle behind the moving average, which filters out short-term noise so that the larger direction becomes visible. People learning charts often go looking for complicated patterns first, but what actually matters is reading the two basic elements, price and volume, accurately. These two articles are the alphabet of chart reading. Looking at price without volume is like watching someone’s lips move with the sound turned off, because volume is what tells you how many people agreed when the price moved. By the end of this stage you will be able to open an unfamiliar chart and judge for yourself whether the price is rising or falling, and whether there is force behind that move.
Stage 2 — price structure: where price comes to rest
Price does not move at random; it often stops or turns at particular levels that people are conscious of. Levels where price once rose or fell sharply, where large numbers of people bought and sold, become psychological reference points in later trading. Support and resistance covers why such levels form, how to draw them, and how to interpret a breakout. Price remembers particular levels because the psychology of those who bought and sold there feeds into the next round of trading. It is important to understand support and resistance as approximate zones rather than precise lines. Many beginners draw a line at exactly one price and are disappointed when it does not hold, but real markets react across a zone. Rather than expecting a support line to hold precisely at the first attempt, it is more realistic to observe how price responds around it, together with volume. By the end of this stage you will be able to draw, as zones, roughly where price meets resistance and where it finds support, and to weigh whether a breakout is genuine using volume alongside it.
Stage 3 — indicators: summarising the flow of price by calculation
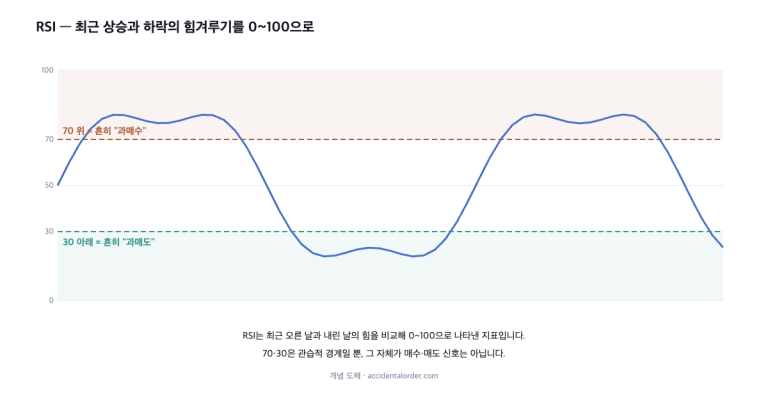
RSI and MACD are the representative indicators that process price movement through a formula to extract signals of overheating, exhaustion or a change of trend. The word “indicator” — auxiliary by nature — is the key. These are second-order information derived from price, so they do not replace the raw material of price and volume. In cooking terms, price and volume are the ingredients and indicators are the sauce made from them. However refined the sauce, it is no use if the ingredients have gone off. You also learn why trading on indicators alone is dangerous. In stocks where price jumps around on thin trading in particular, the indicators jump with it and throw out false signals in bulk. By the end of this stage you will understand what RSI and MACD actually measure, and be able to use them as support without treating them as gospel.
Stage 4 — verification and reality: before you trust a signal
This is the most important stage in technical analysis, and the one most often skipped. The moment you get caught up in the fun of learning signals and skip verification, groundless conviction starts to grow. Backtesting: an introduction is about applying a trading rule to historical data to check its performance, and at the same time about how easily a backtest deceives you through traps such as overfitting, look-ahead bias and survivorship bias. Finally, Overlooked stocks and liquidity points to the liquidity trap in which a chart looks good but you cannot in fact buy or sell at the price you want, and ties the fundamental track and the technical track together. By the end of this stage you will have the mature habit of trusting no signal without verification and of asking whether it can actually be executed. The most valuable lesson in technical analysis is exactly this habit of sceptical verification.
What this track does not say
“Memorise chart patterns and you can predict the price” — no. Technical signals only tilt the odds slightly; they do not foretell individual outcomes. The same pattern is sometimes right and sometimes wrong.
“The more indicators, the more accurate” — no. Indicators are all derived from the same price, so stacking several of them does not produce genuinely different information. It is more likely to amplify the illusion of a signal.
“You can invest on technical analysis alone” — we would not recommend it. Technical analysis is a supporting tool for execution timing and risk management; what to buy and why has to be answered by fundamentals. The chart is the hand that carries out that answer, not the head that produces it.
Where technical analysis genuinely earns its keep
The limits have been emphasised, but there are places where technical analysis clearly helps. First, the timing of execution. Once you have picked a good company on fundamentals, it is better to build a position after a pullback has settled the price than while it is overheated. Support and resistance and trend serve as a reference for gauging that moment. Second, risk management. Deciding in advance, from the structure of the chart, how far the price can fall before you regard your judgement as wrong stops you from being swept along by emotion and enlarging a loss. The discipline of accepting a loss and stepping back has far more effect on long-term results than any spectacular entry signal.
Third, it helps in reading the mood of the market. A surge or a collapse in volume, or a break from a trend, reflects a shift in participants’ psychology. From this you can take a rough temperature of whether the market is running hot or cold. Knowing the temperature does not let you forecast tomorrow’s weather, but it is quite enough for deciding whether to take an umbrella. All of this usefulness, though, sits within the scope of “reference”. The moment a technical signal is elevated into an absolute trading order, the tool turns into a trap. Knowing where usefulness ends and limitation begins is itself the core capability of this track.
Why this order
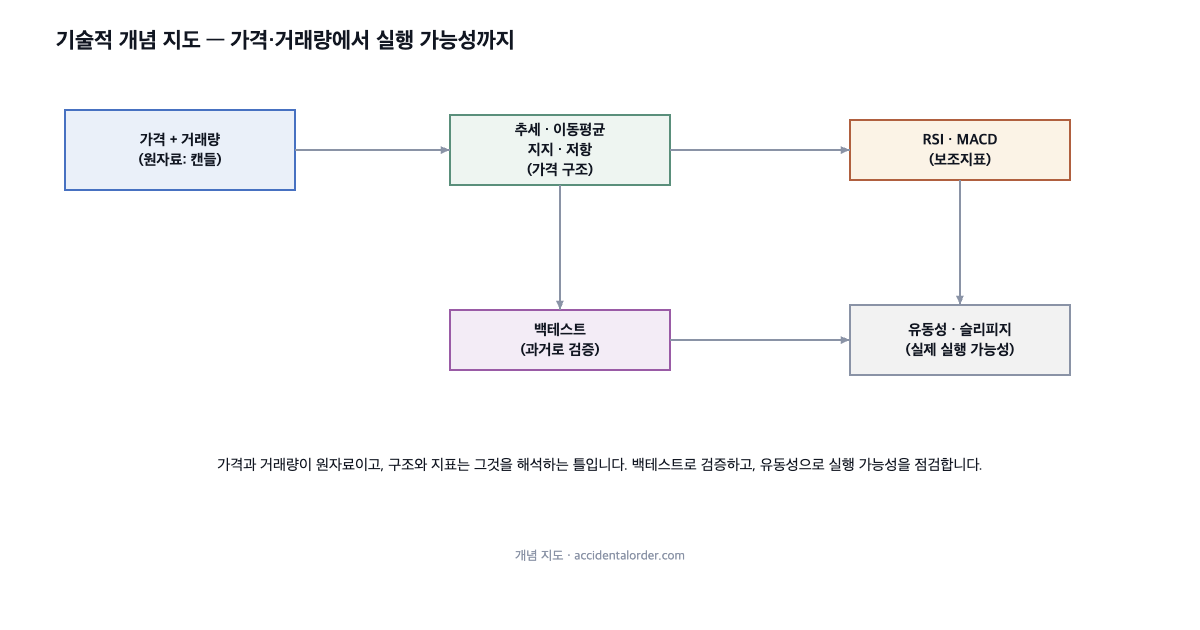
There is a reason for the order of the roadmap. You have to be able to read the raw data of candles and volume before the trendlines and support-and-resistance drawn on top of them mean anything. And you have to understand price structure before you get a feel for what indicators such as RSI and MACD, which summarise that structure in a formula, are actually measuring. Learn the indicators first and you chase signals without the principles, easily buffeted about without understanding why an indicator fails. Building from the bottom up, from the concrete to the summarised, is the safe route.
Above all, placing verification (stage 4) last — but making it compulsory — is the heart of this track. If the first three stages are about learning signals, the final stage is about doubting and testing them. Learning a signal is easy; training yourself to confirm with data whether that signal really works is difficult and dull. Skip this stage anyway and you end up staking large sums on groundless conviction. An unverified signal, however plausible it looks, amounts in the end to leaving things to luck. It is in the same spirit that backtesting and liquidity sit at the bottom of the concept map, holding up everything above them.
Key terms worth learning in advance
Before following the roadmap, here is a short summary of the terms that will keep coming up. A candle (bar) shows the open, high, low and close of a given period as a single bar, and volume is the number of shares that changed hands in that period. A moving average is a line joining the average of closing prices over a set period, filtering noise to show direction. Support means the zone below at which price tends not to fall further, and resistance the zone above through which it struggles to rise.
RSI is an indicator that compares the force of recent gains and losses and expresses overheating or exhaustion on a scale of 0 to 100, while MACD reads the direction and strength of a trend from the gap between two different moving averages. A backtest is the exercise of applying a trading rule to historical data to check its performance; slippage is the difference between the price you want and the price at which the trade is actually filled; and liquidity is the degree to which you can buy or sell the quantity you want near the price you want. How each of these terms is used at each stage is covered in detail in the individual articles. For now it is enough to have a rough sense of what each one measures.
Three tips for studying on your own
First, verify with a record before you stake anything large in practice. When you learn a new signal, write your prediction down on paper instead of trading it, and follow what happens afterwards. Whether that signal really works for you is answered not by what others say but by your own data. Only a signal that has been through this process becomes the basis for a conviction that holds up in live trading.
Second, understand the principles rather than adding indicators. Filling the screen with indicators feels reassuring, but most of them derive from the same price and so offer no new insight. Understanding a few indicators deeply is far better. The more indicators you have, the more certain it is that one of them is always giving you some signal — and you end up seeing only what you want to see.
Third, always think about risk management first. The real value of technical analysis lies not in getting the price right but in the discipline of limiting losses when you are wrong. Deciding in advance where you will accept that your judgement was mistaken and step back matters more than any spectacular signal.
How to use this
We recommend reading in order. Stage 1 in particular (candles and volume, trend and moving averages) is the foundation for everything else, so it is best learned first. Unlike fundamentals, though, technical analysis calls for the extra caution of not immediately staking large sums on what you have just learned. When you find a signal, observe it with a small amount or verify it on paper, and get into the habit of confirming with data whether that signal really works for you. The backtesting in stage 4 is precisely that tool of verification, and the article on overlooked stocks is a reminder that even a verified signal cannot be executed without liquidity. Betting large sums the moment you learn something is the commonest and most expensive mistake in technical analysis. Conviction about a signal should come from your own verified record, not from someone else’s success story.
Technical analysis pairs with the fundamental analysis roadmap. Fundamentals answer what to buy; the technical and liquidity perspective complements it with when and how to execute. Judgement becomes whole only when both tracks are learned together. Pick a good company and you can still leak returns by walking into a liquidity trap when buying and selling; conversely, be skilful in execution and it hardly matters how well timed you are if you chose a bad company to begin with. The two tracks are complements, not competitors.
Checking yourself after the course
Once you have read all six articles, check yourself against the following. When you open an unfamiliar chart, can you read which way, and with how much force, the price is moving (candles, volume, trend)? Can you draw, as zones, roughly where price meets support and resistance? Do you know what RSI and MACD measure, and when to doubt their signals? When you see a trading rule, can you ask back whether its performance has been inflated by overfitting or bias? And finally, when faced with a stock whose chart looks good, do you first check whether there is the liquidity to actually buy and sell at the price you want?
If you can answer these questions, you are someone who treats the chart as a tool rather than a book of prophecy. That is the real difference between a beginner and an experienced hand in technical analysis. It is not knowing spectacular patterns; it is knowing the limits of a signal and managing risk. The experienced always assume they may be wrong, and design their judgement on top of that assumption.
The chart is not a prophecy — a balanced view
There is a long-running debate around technical analysis. On one side is the argument that if the market has already reflected all information in the price, then predicting the future from patterns in past prices is impossible; on the other is the counter-argument that psychology and herding genuinely repeat in real markets, so a degree of regularity remains in the flow of price. Neither side is entirely right or entirely wrong. What is clear is that even if regularity exists, it is probabilistic and it changes over time. A pattern that once worked well can have its effect worn away as it becomes widely known.
So we use technical analysis humbly. We do not take signals on faith; we verify them, we manage risk, and we leave the judgement of what to buy and why to fundamentals. The chart is an excellent supporting tool, but it must not become the master. The moment the tool takes the master’s seat, we are no longer reading the market but being driven by it. This is the message the whole track is meant to convey. Learn signals, but do not be ruled by them.
Frequently asked questions
Q1. Can you make money on technical analysis alone?
That is hard to say with any certainty. Technical signals are a probabilistic reference, not a guarantee. They help with execution timing and risk management, but they are more robust when combined with a judgement about what to buy and why (fundamentals).
Q2. Which indicators should I use?
Understanding the principles and using few is better than using many. What matters more than the indicator itself is knowing what it measures and when it fails. We suggest starting with something like RSI and MACD, understanding what each measures, and then using them only as support for your own judgement.
Q3. If a backtest performs well, will it work in live trading?
Not necessarily. Overfitting, survivorship bias and transaction costs make backtests easy to exaggerate relative to reality. The introduction to backtesting covers those traps in detail, along with the need for forward verification (paper trading).
Closing the investing course
With this technical roadmap and the earlier fundamentals roadmap, the main skeleton of the investing course prepared by The Accidental Order is complete. One attitude runs through both tracks: building the capacity to judge for yourself from public material, instead of taking down someone else’s conclusions. Fundamentals is training in confirming a company’s value from its filings; technical analysis is training in handling timing and risk when putting that value into practice. If one is a compass, the other is seamanship, and only with both can you sail the ship yourself. Neither promises a magic formula. What they promise instead is grounding and discipline that do not waver.
Those who survive a long time in investing are not the ones who know the flashiest techniques but the ones who know what they know and what they do not. We hope this series is a small stepping stone towards that discernment. Now that you have the concepts, move on to real companies and real charts and put the questions you have learned, one by one. The company analyses and screening cases we publish will serve as a guide to that practice. The studying does not end here; it begins here.
※ This article does not recommend trading in any particular stock; it is a study guide for educational purposes. Responsibility for investment decisions and their outcomes rests with the investor.