When the Cash Is Heavier Than the Company: Nine Korean Companies at 30%+ Net Cash
Net cash is a plain arithmetic idea. Take cash and cash equivalents, add short-term financial instruments, subtract total borrowings. What is left is the money the company would still hold if every lender were repaid tomorrow.
Divide that by market capitalisation and the ratio has an unusually direct reading: the share of the price you are paying that is already sitting in the company’s own bank accounts. At 30%, roughly a third of what the market is charging for the business is cash the business already has. At 100%, the entire market price is matched by the cash pile, and the operating company comes attached at no additional charge.
That reading is why this is the second brief. It requires no view about margins, no discount rate, and no projection of what comes next. It is a balance-sheet fact divided by a closing price.
It also turned out to be the hardest column in the dataset to close honestly, and that is most of what follows.
What the filings say
On 14 August 2026, across 183 non-financial listed companies, net cash is published for 97. Of those, 51 hold more cash than debt. The distribution is steep: 30 companies sit between 0 and 10% of market capitalisation, 12 between 10 and 30%, five between 30 and 50%, three between 50 and 100%, and one above 100%.
The median company among the 97 sits at 0.7%. Net cash, in other words, is normally a rounding error against market capitalisation. The interesting part of this distribution is entirely in its tail.
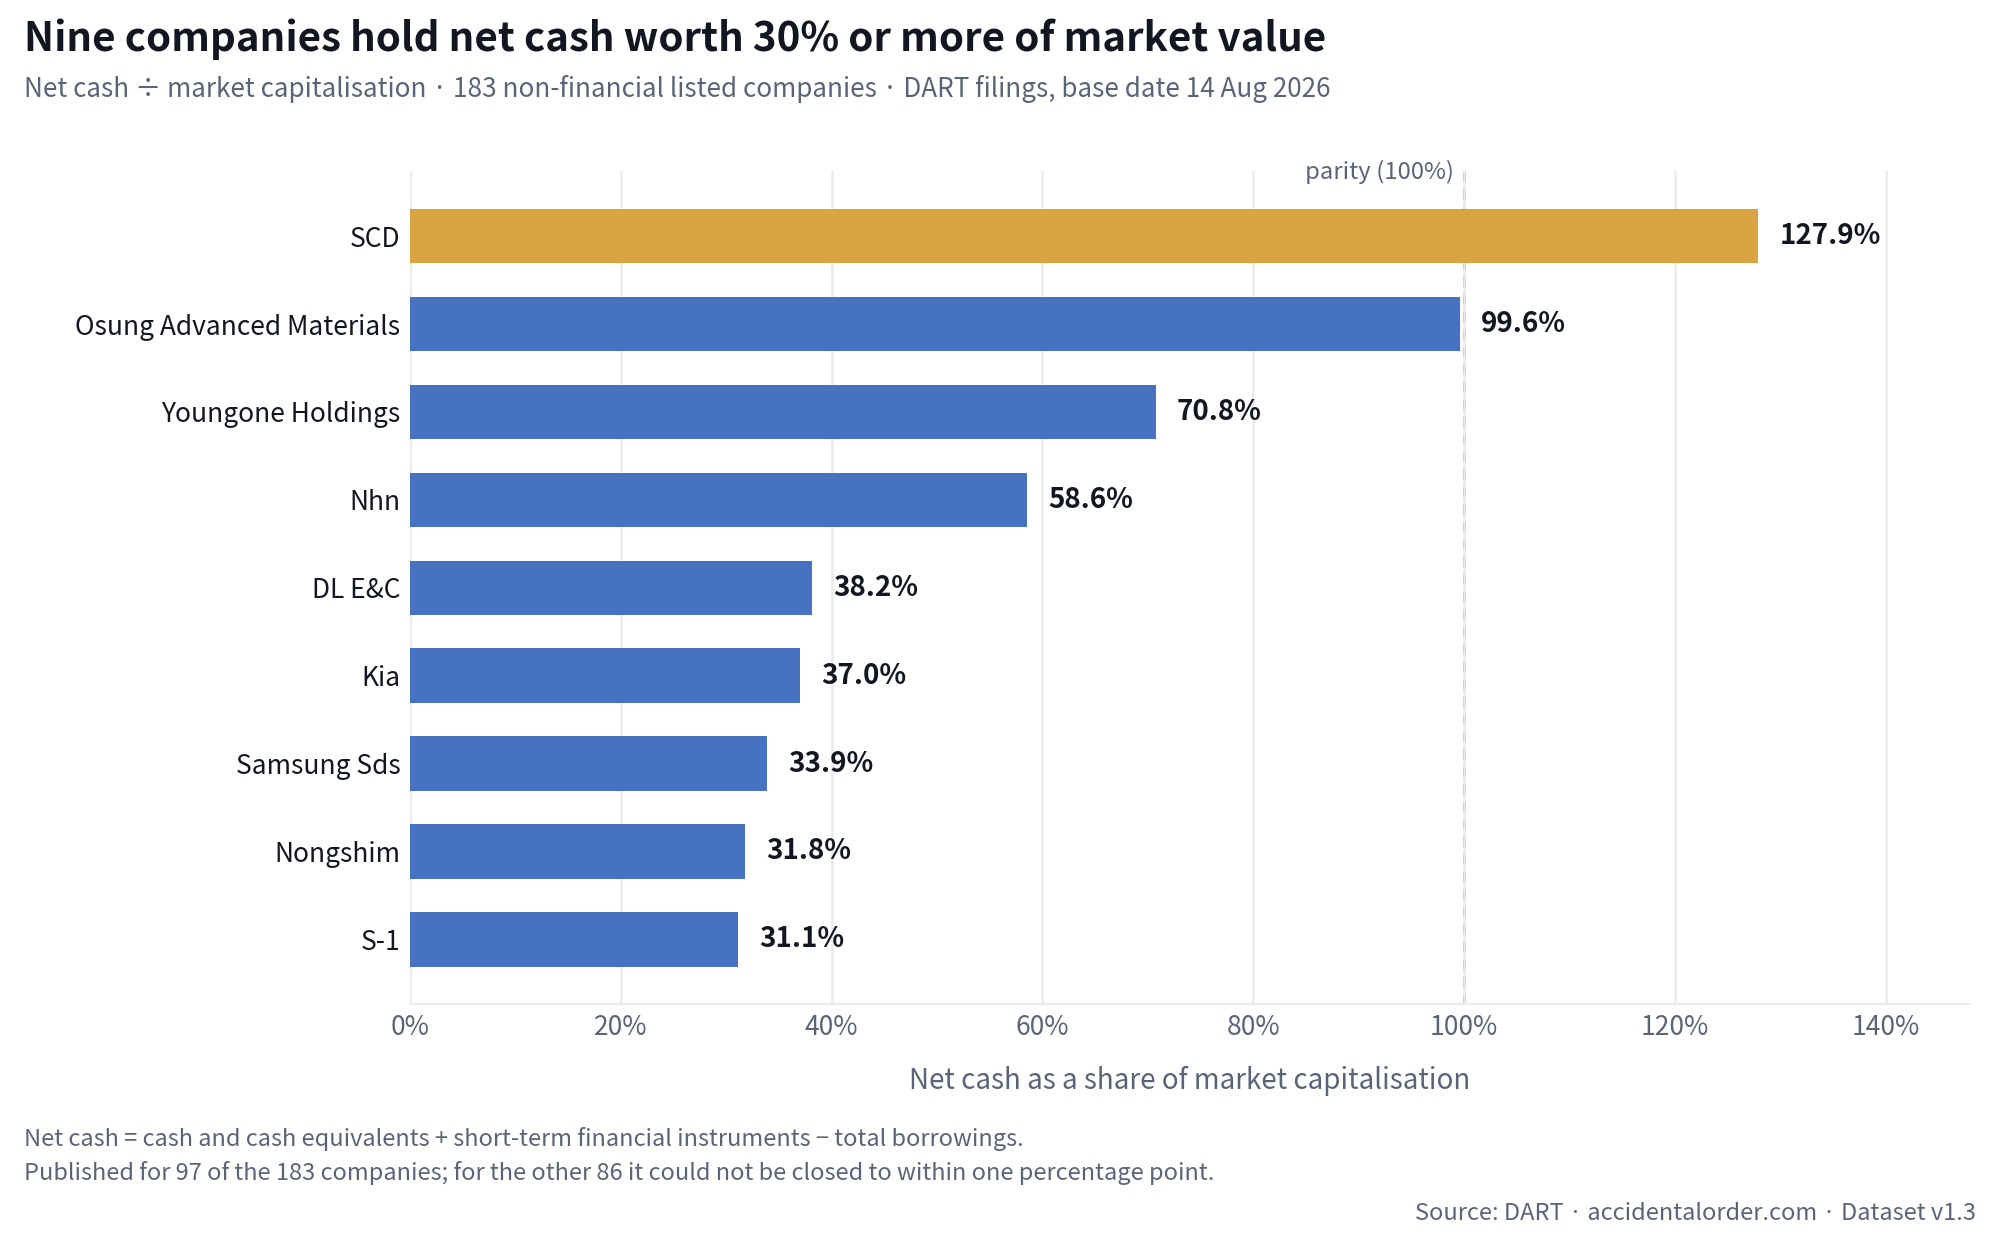
Here is that tail in full — every company at 30% or above.
| # | Company | Ticker | Net cash ÷ mcap | Net cash (KRW bn) | Market cap (KRW bn) | P/B (owners) |
|---|---|---|---|---|---|---|
| 1 | SCD | 042110 | 127.9% | 70.0 | 54.7 | 0.40x |
| 2 | Osung Advanced Materials | 052420 | 99.6% | 91.2 | 91.6 | 0.33x |
| 3 | Youngone Holdings | 009970 | 70.8% | 1,736 | 2,454 | 0.81x |
| 4 | NHN | 181710 | 58.6% | 1,433 | 2,447 | 1.67x |
| 5 | DL E&C | 375500 | 38.2% | 1,090 | 2,856 | 0.54x |
| 6 | Kia | 000270 | 37.0% | 20,470 | 55,322 | 0.90x |
| 7 | Samsung SDS | 018260 | 33.9% | 6,380 | 18,842 | 1.90x |
| 8 | Nongshim | 004370 | 31.8% | 845.5 | 2,661 | 0.94x |
| 9 | S-1 | 012750 | 31.1% | 918.7 | 2,952 | 1.68x |
Three observations, all of them descriptive.
One company is above 100%. SCD, an electrical-equipment maker with a market capitalisation of KRW 54.7bn, reports KRW 70.0bn in net cash. Its balance sheet carries no account named as a borrowing or a bond, and no aggregate financial-liability line either. This is the configuration the phrase “net-net” was originally coined for — a term that here means only the arithmetic relationship between current assets net of all liabilities and market price, and nothing about whether that price is right.
Six of the nine trade below book. SCD at 0.40x, Osung at 0.33x, DL E&C at 0.54x, Youngone Holdings at 0.81x, Kia at 0.90x, Nongshim at 0.94x. The other three — NHN, Samsung SDS, S-1 — trade above book while still holding a third or more of their price in cash.
The list is not concentrated in one kind of company. Electrical equipment, plastics, an apparel holding company, an internet platform, a construction firm, a carmaker, an IT services company, a food company, a security services company. Nine companies, nine sectors.
Kia is the outlier by size. Its KRW 20,470bn in net cash is more than the other eight companies on this list hold combined (KRW 12,564bn), and accounts for 62% of the KRW 33,034bn held across all nine.
The trap we walked into
This is the part worth reading if you build datasets yourself, and the reason this brief is a week later than planned.
Total borrowings, in this dataset, are defined as the sum of every leaf line on the balance sheet whose account name contains “borrowing” or “bond”, excluding lease liabilities. That definition exists because the obvious approach — map the four component accounts, short-term borrowings, current portion of long-term debt, long-term borrowings, bonds — fails on real filings in at least six distinct ways. A name-based sum is robust against all six.
It has one blind spot, and it is a large one. Some companies split the balance sheet only into financial and non-financial liabilities. Their borrowings sit inside captions like “current financial liabilities” and “non-current financial liabilities”. No account name contains “borrowing”. No account name contains “bond”. The scan returns zero, the completeness check — total borrowings must not exceed total liabilities — passes trivially, and net cash comes out equal to gross cash.
The day before this brief was due, running the numbers for it, that pattern surfaced. Korea Electric Power carried KRW 150,466bn in aggregate financial liabilities and was being read as having no borrowings at all. Korea Gas, HD Hyundai, LG Display, GS Engineering & Construction, Kakao — the same shape. Twenty-nine rows in the live table were showing a larger net cash position than the filings support. Five of the seventeen companies then listed at 30% or above were there because of it. Eighteen of the thirty-two companies the dataset described as carrying no borrowings were in fact carrying material aggregate financial liabilities.
Had this brief run on schedule, its headline table would have been wrong in five of seventeen rows, and its most quotable claim — these thirty-two companies have no debt at all — would have been false for eighteen of them.
The fix is not to add the aggregate captions to borrowings. Lease liabilities, deposits received and derivative liabilities sit inside them; adding the whole caption would break the definition and overstate debt, and splitting it would require guessing at a division the filing does not disclose.
What v1.3 does instead is bound the exposure. Every financial-liability line on the balance sheet is collected — derivative captions, “other” captions, everything, with no judgement made about what any of them contains — and one question is asked: if all of them were borrowings, how far could the published ratio move?
If treating the entire aggregate as borrowings could move net cash over market capitalisation by one percentage point or more, net cash is not published: the cell is blank and the row carries a
NC?flag. If it could move it by less than one point, the figure is published.
The limit is set against net cash over market capitalisation rather than against total liabilities, because the question that matters is not how large the aggregate is on the balance sheet but how far it could move the number being published. So the test is denominated in the same unit as the published number.
This is a bound, not an estimate. No position is taken on what the aggregate captions actually hold. The consequence is a sentence that needs no qualification:
Every net-cash-to-market-capitalisation figure in this dataset is accurate to within one percentage point even if every aggregate financial-liability line on the balance sheet turned out to be borrowings.
The cost of being able to write that sentence without a footnote was 85 rows. Net cash is now published for 97 companies rather than 182. Companies showing positive net cash fall from 80 to 51. The 30%-and-above list falls from 17 to 9. Companies described as carrying no borrowings fall from 32 to 15.
Across the 97 figures that survive, the bound is at most 0.951 percentage points, with a median of 0.004. For most of them the question is not close.
What shrank is not the cash these companies hold. It is the range over which the filings can be closed.
Why the blank cells matter more than the numbers
A dataset that reports a figure for every row is either working with unusually clean source data or quietly filling gaps. Eighty-six blanks out of 183 is not a defect being disclosed; it is the disclosure regime being reported accurately.
Korean filings are XBRL-tagged, which sounds like it should settle the matter. In practice the tagging is a floor, not a ceiling: a company may satisfy every requirement while presenting its liabilities at a level of aggregation that makes a specific derived figure impossible to compute from the filing alone. Nothing is being concealed. The information simply is not there at the granularity the calculation needs.
The alternative to a blank cell is not a better number. It is the same blank, filled with an assumption, and reported as though it were read off a filing. Every company page in this dataset that shows no net cash figure states which of the two cases applies and gives the aggregate that could not be resolved, so a reader who wants to make their own assumption can do so with the number in front of them.
What this is not
This brief has ranked companies by a ratio. It has said nothing about whether any of those prices is right, and the dataset does not carry a column that could support such a statement.
A company can hold cash worth more than its market price for reasons a balance sheet does not show: an operating business consuming that cash, a controlling shareholder with no intention of distributing it, a pending obligation not yet recognised, or a market judgement about the future that the historical statements cannot contradict. The ratio in the table above is a fact about a filing and a closing price on one day. It is not a conclusion, and nothing here is a recommendation to buy or sell any security.
What the ratio does is narrow a field of 183 companies to 9 for whatever question you brought with you.
Where the numbers are
Every figure above comes from DART filings, with a receipt number attached to each company page so the original filing is one click away. The full dataset — 38 columns, including agg_fin_liab_eok and agg_fin_bound_pp, the aggregate total and the bound for each company — is available as a CSV. The bound rule is set out in §5 of the methodology, and v1.3’s changes are listed in the changelog.
- The full table — 183 companies, sortable, with the CSV
- Methodology — §5 sets out the bound rule; the changelog lists what v1.3 changed
- The nine companies above: SCD · Osung Advanced Materials · Youngone Holdings · NHN · DL E&C · Kia · Samsung SDS · Nongshim · S-1
- Brief #1 — The Owner’s Share: P/B for 183 Korean companies
Source: DART filings · Dataset v1.3 (changelog) · Base date 14 August 2026 · Next update: Q3 filings (Nov 2026). This brief is a record of what the filings say. It is not a recommendation to buy or sell any security, it carries no price target and no view on where any share price is going.
Get the next quarterly update for this company by email
When the next results are filed we send where this scenario stands. Nothing else.