EV/EBITDA and DCF: Valuation Beyond Market Capitalisation
The PER and PBR we learned earlier are powerful, but they share one large weakness. Both look only at market capitalisation — the price of the shareholders’ portion — and ignore the debt a company carries and the cash it has piled up. Yet from the standpoint of someone buying the company outright, you take on its debt along with the shares and receive its cash as well. The valuation measure that reflects this capital structure is EV/EBITDA, and the one that goes a step further and estimates value from future cash flows themselves is DCF. This article covers how both tools work and, in particular, the traps by which they mislead people.

EV — the price of buying the whole company
EV (enterprise value) expresses “what would it actually cost to acquire this company outright?” The calculation is simple: EV = market capitalisation + net borrowings (debt − cash). Buy the company and you pay the shareholders the price of the shares (market capitalisation), you also take on the debt the company carries — so you add it — and in exchange the cash the company held becomes yours, so you subtract it. A heavily indebted company therefore has an EV larger than its market capitalisation, and a cash-rich company has an EV smaller than it.
Why does this distinction matter? Take two companies with the same market capitalisation: if one is buried in debt and the other is flush with cash, the actual price of buying them is completely different. PER and PBR cannot see that difference, but EV can. In a net-cash company where cash far exceeds debt in particular, EV falls well below market capitalisation, revealing “what the market thinks the business itself is worth”.
Measured — is Muhak’s business worth KRW 6.6bn to the market?
Let us see the power of EV through the stocks we analyse. Put market capitalisation and EV side by side and the force of net cash becomes visible.
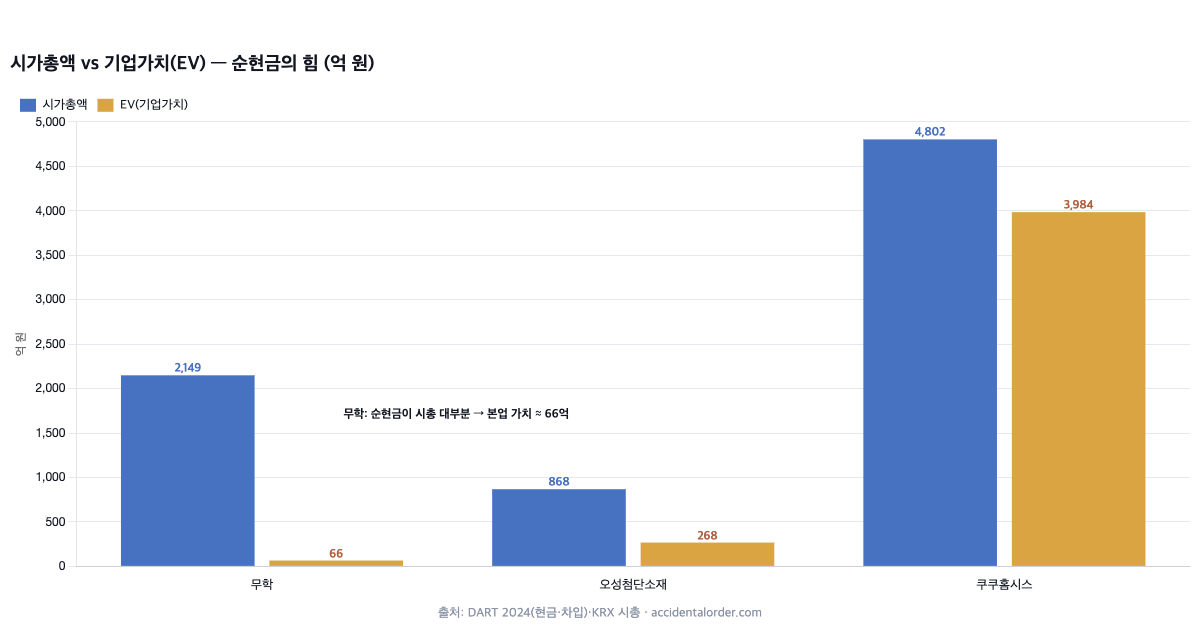
The most dramatic case is Muhak. Market capitalisation is roughly KRW 214.9bn, while cash and cash equivalents plus financial instruments come to roughly KRW 250.3bn and borrowings to roughly KRW 42.0bn, so net borrowings are heavily negative (net cash). As a result EV is a mere KRW 6.6bn or so. What that implies is startling — the market is valuing Muhak’s core soju and bottled-water business at just KRW 6.6bn. Most of the value embedded in the share price is the cash and financial assets the company holds, and the business itself comes along almost for free.
Had you looked only at PER or market capitalisation, this fact would have stayed invisible. Osung Advanced Materials (EV of roughly KRW 26.8bn) also has an EV far below its market capitalisation of KRW 86.8bn, and Cuckoo Homesys (EV of roughly KRW 398.4bn) is a little below its market capitalisation of KRW 480.2bn. In this way EV shows “the price of the pure business with the cash stripped out”, which makes it especially useful when valuing asset-heavy companies sitting on thick net cash.
For reference, when calculating EV, “net borrowings” includes interest-bearing borrowings and bonds, and subtracts cash and cash equivalents plus short-term financial instruments that can be converted to cash immediately. Depending on the company, the detailed rules for how to treat lease liabilities, preferred shares, non-controlling interests and so on can differ slightly, so when comparing several companies you must check that they were calculated on the same basis. As with the earlier experience in a stock analysis where total equity was aggregated incorrectly and the metrics went wrong, accuracy in valuation is decided by making the definitions of the numerator and denominator match.
Dwell on Muhak’s EV of KRW 6.6bn again and it becomes clear why valuation tools are needed. Looked at through market capitalisation alone it is “a KRW 214.9bn company”; looked at through EV it is “a company whose core business is valued at KRW 6.6bn and whose remainder is cash”. Completely different pictures. A good tool lights the same company from a different angle like this and exposes the substance hidden behind the surface number. That is why it is worth learning several valuation measures.
EV/EBITDA — the price of the business over the profit of the business
EV divided by EBITDA gives EV/EBITDA. EBITDA is operating profit with depreciation added back — “earnings before interest, taxes, depreciation and amortisation”, a measure of the rough cash-generating power the business produces. EV/EBITDA means “the price of buying this company outright, as a multiple of the cash-like profit it earns”. If PER is a multiple from the shareholder’s viewpoint, EV/EBITDA is a multiple from the viewpoint of the whole company, encompassing both shareholders and creditors.
EV/EBITDA has several advantages over PER. First, it reflects debt and cash (capital structure). Second, it allows a fairer comparison of companies with different depreciation methods, tax rates and capital structures. That is why it is especially widely used in sectors with heavy capital expenditure or widely varying debt levels, and in valuing acquisitions. It also fits neatly with the intuition of “how many years of EBITDA would it take to recover the purchase price if I acquired this company?”
The EBITDA trap — depreciation is a real cost
EV/EBITDA has a trap of its own, however: EBITDA ignores depreciation. Depreciation is a non-cash cost, so it is added back in EBITDA — but that equipment has to be replaced eventually. In other words depreciation is “advance notice of cash that will go out again in the future”, and EBITDA pretends not to see it.
So for companies that continually need large capital expenditure (heavy industry, telecoms, some manufacturers), EBITDA can look impressive while cash drains away each year into replacement capex, leaving far less for shareholders in reality. This is why Warren Buffett, wary of EBITDA, quipped that “if you think depreciation is not a cost, you believe the company gets that equipment free from a fairy”. When looking at EV/EBITDA you must always look at capital expenditure (capex) and free cash flow alongside it.
DCF — pulling future cash flows back to the present
The most fundamental method of valuation is DCF (discounted cash flow). The idea runs like this. The value of a company is ultimately the sum of all the cash it will earn in the future. But KRW 1,000 in the future is worth less than KRW 1,000 today (it is uncertain, and you forgo the interest in between), so you shave future cash down to present value at an appropriate discount rate and add it all up. That sum is the company’s theoretical value.
DCF is different in kind from the earlier measures. Where PER, PBR and EV/EBITDA are “relative measures compared against other companies or against the past”, DCF is an attempt to estimate absolute value from the company’s own cash generation. It is therefore powerful when you understand the business deeply and can sketch its future cash flows. The cash flow statement and the concept of free cash flow learned in this track are the raw material for DCF.
The DCF trap — the assumptions rule
DCF’s biggest weakness is that the result is extremely sensitive to the assumptions. What future growth rate to use, what discount rate to set, what perpetual growth rate to assume for the distant future — change just a few of these slightly and the result shifts by a factor of two or three. Estimates become less accurate the further out you go, and yet a substantial part of a company’s value comes from that distant future.
So DCF is less a “calculator that gives a precise right answer” than a “thinking tool that shows you what your assumptions imply”. Fix the answer you want in advance and work the assumptions backwards and you can manufacture any conclusion, which makes it easy to misuse in justifying your own convictions. In practice, therefore, rather than trusting a single number, people vary the assumptions across a range (sensitivity analysis) and work backwards to ask “under what assumptions is this price justified?”
Looking through the eyes of an acquirer
The easiest way to understand the idea behind EV is to imagine acquiring the company outright. Buying up all the shares and paying the market capitalisation is not the end of it. The debt the company owes the bank now becomes your responsibility, and conversely the cash sitting in its vault becomes yours the moment you acquire it. So “what it truly cost to get this company into your hands” is market capitalisation plus debt minus cash — that is, EV.
That is why private equity funds and strategic acquirers value companies on EV rather than market capitalisation. An individual investor who borrows this perspective gets a markedly more accurate valuation, because the question becomes not “is the share cheap?” but “if I bought this entire business at this price, would it pay?” The difference this perspective makes is large in companies with a lot of cash or a lot of debt.
EV/EBIT — the alternative that brings depreciation back
Because of the trap of EBITDA ignoring depreciation, people also look at EV/EBIT, calculated with depreciation deducted again (on an operating profit basis). EBIT is effectively the same as operating profit, so it reflects the wear on equipment (depreciation) in full as a cost. When looking at a capital-intensive company, rather than judging it cheap on EV/EBITDA alone, it is safer to look at EV/EBIT or a multiple against free cash flow as well.
The key is that whatever profit measure you use, what matters is how much it reflects the burden of depreciation and reinvestment. As learned in the cash flow statement piece, the money genuinely left for shareholders is the free cash flow that remains after replacement capex has been deducted. The closer the denominator of a valuation multiple is to that free cash flow, the more honestly the multiple reflects reality.
The two pieces of a DCF — the forecast period and terminal value
A DCF usually consists of two pieces. First, you estimate and discount cash flows year by year over a period that is at least somewhat forecastable, such as the next five to ten years. Second, the distant future beyond that is bundled into a single figure calculated as “terminal value”. The problem is that a substantial part of the company’s value — sometimes more than half — comes from that terminal value.
Terminal value is derived by dividing the distant future’s cash flow by the perpetual growth rate and the discount rate, and small differences in these two values swing the result greatly. Whether you assume a perpetual growth rate of 2% or 3%, for example, changes the value by tens of percent. So a paradox arises in which the conclusion of a DCF depends most heavily on “the assumptions about the most uncertain, most distant future”. Know this structure and you will stop believing uncritically in an elaborate DCF target price that someone hands you.
The discount rate — why future money is shaved down
The heart of a DCF is the discount rate. It is the rate at which future cash is shaved down, and usually the company’s cost of capital (WACC) is used. The higher the discount rate, the smaller the present value of future cash and the lower the resulting company value. And risk is reflected in that discount rate — the more uncertain the company, the higher the discount rate applied and the more heavily future cash is shaved.
The discount rate is also directly linked to the interest-rate environment. When market rates rise, the discount rate rises too and the present value of all future cash shrinks. High-growth stocks, whose value sits mostly in the distant future, are pressed down hard by rising rates in particular. The same principle we discussed in the PER piece when talking about the earnings yield and interest rates operates in DCF through the discount rate. Valuation ultimately sits inside the larger context of interest rates.
Margin of safety — how to live with imperfection
Every valuation tool we have looked at is imperfect. So the value-investing tradition does not try to “pin down fair value exactly”; it endures that imperfection by buying only at a price sufficiently cheap relative to the estimated value. This “gap between value and price” is the margin of safety. It leaves room so that you do not take a loss even if your estimate is somewhat wrong.
Thinking in terms of margin of safety changes your attitude to valuation. Instead of the precise conviction that “the fair price of this company is exactly KRW 52,000”, you come to ask “does the current price look sufficiently cheap under any reasonable set of assumptions?” This humility is the way not to be fooled by valuation numbers that look precise but in fact wobble.
So how do you use these valuation tools?
Summing up the four tools: PER is fast and intuitive but cannot see capital structure or the quality of earnings. PBR is price against assets, but is governed by the quality of those assets. EV/EBITDA reflects debt and cash but ignores depreciation. DCF is the most fundamental but is ruled by its assumptions. None of them is universal. So you choose the tool that suits the character of the company, cross-check from several angles, and use the result to gauge whether the price is “broadly on the cheap side or the expensive side”.
Above all, valuation is not an exact science. Calculate to the decimal place and the number still shifts with your assumptions and the point in time. So rather than searching for “exactly what the fair price is”, it is more realistic to keep a wide margin of safety and ask “does this look sufficiently cheap?” This way of thinking about margin of safety is how you live with the imperfection of valuation.
Where EV is useful, and where it confuses instead
EV shines particularly for companies with large net cash or heavy debt, and in valuation from an acquisition perspective. But it is not universal. In financial businesses such as banks and insurers, liabilities (deposits, insurance liabilities) are the raw material of the business itself, so the EV concept of adding and subtracting debt does not fit well. Such sectors are valued not on EV but on PBR, ROE and equity-related measures. Holding companies, too, are easily misread on a simple EV because of the peculiarity of the value of their stakes in subsidiaries.
So EV/EBITDA too must ultimately be used “appropriately, in the right sector”. What you have to learn alongside a valuation tool is where that tool works and where it breaks down. Knowing a tool’s formula and knowing when to use it are different abilities, and the latter is far harder and far more important.
Valuation comes after understanding the company
Finally, a word about order. However sophisticated the EV/EBITDA or DCF, it is a shell if the understanding of the business underneath is poor. To sketch future cash flows you have to know what the company earns its money from and how long that profit can last (ROE and the moat). Numbers are a tool for quantifying your understanding of the business; they cannot substitute for it.
So valuation always comes after reading the financial statements and analysing the business. First judge whether it is a good company, and only then use these tools to gauge “whether that good company is cheap at today’s price”. If the order is reversed and the valuation number becomes the starting point of the judgement, it is easy to justify a bad decision with an elaborate calculation. The more powerful a tool is, the more it matters what you point it at.
Frequently asked questions (FAQ)
Q1. Can EV be smaller than market capitalisation?
Yes — in a net-cash company where cash exceeds debt. When net cash approaches market capitalisation, as at Muhak, EV becomes very small, which means the market rates the business itself that lowly. For such asset-heavy companies you have to look through EV rather than PER to see the substance.
Q2. What EV/EBITDA multiple counts as cheap?
It varies greatly by sector. Mature industries are typically in the high single digits, while double digits are normal for high-growth, high-return industries. Rather than an absolute standard, compare against the same sector and against the company’s own history, and look at the depreciation (capex) burden alongside it.
Q3. Should an individual investor build a DCF?
You do not need to run an elaborate model yourself, but the feel for roughly gauging “what growth would have to be assumed for this price to be justified” is useful. Understanding the spirit of DCF — that value is the present value of future cash — helps you avoid being swept along by excessive optimism.
Valuation tools summary checklist
- PER: fast, but blind to capital structure and earnings quality. Check whether profit is at a normal level.
- PBR: price against assets. Use with asset quality and ROE.
- EV/EBITDA: reflects debt and cash. But look at depreciation (capex) alongside it.
- DCF: fundamental, but ruled by assumptions. Check “backwards” with sensitivity.
- Common to all: never trust one blindly — cross-check, and keep a margin of safety.
Summary
EV adds debt to market capitalisation and subtracts cash to express the price of buying a company outright. Where net cash is thick, as at Muhak, EV falls far below market capitalisation and the real price of the business is revealed. EV/EBITDA reflects capital structure but carries the trap of ignoring depreciation, while DCF is the most fundamental but is ruled by its assumptions. Since no measure is universal, the necessary attitude is to pick the tool that suits the company, cross-check, and keep a margin of safety. The next article covers how a company allocates the cash it earns — whether to reinvest, to return it to shareholders through dividends and buybacks, or simply to pile it up. Muhak’s EV of KRW 6.6bn leads in the end to the capital-allocation question of “does the accumulated cash flow out to shareholders?”
Investing study · fundamental analysis. This article is for information only and is not a recommendation to buy or sell any particular security. Figures are based on public data from DART (Korea’s mandatory electronic disclosure system) and KRX (Korea Exchange) and may have changed since the time of writing (July 2026).