The Principles of Asset Allocation: How to Split the Eggs Between Baskets
“Don’t put all your eggs in one basket” is the most famous maxim in investing, yet surprisingly few people have ever actually decided how many baskets to use and in what proportions. Talk of individual stocks is everywhere; talk of proportions is rare. The order has been inverted — that the greater part of long-run performance is settled not by which stocks you picked but by the ratios between asset classes is the conclusion pension funds and institutions have drawn from decades of managing money.
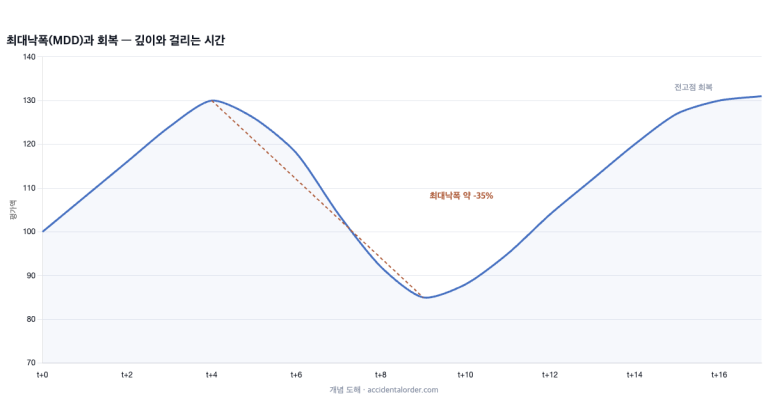
This article deals with the craft of setting those proportions: asset allocation. The character of the asset classes that serve as ingredients, the classic allocation formulas, the rebalancing that maintains the ratios, and the conditions under which asset allocation fails. It stands on the concept of a “bearable MDD” covered in the piece on investment risk, so if you have not read that yet, it is worth reading first.
1. The ingredients: a character sheet for asset classes
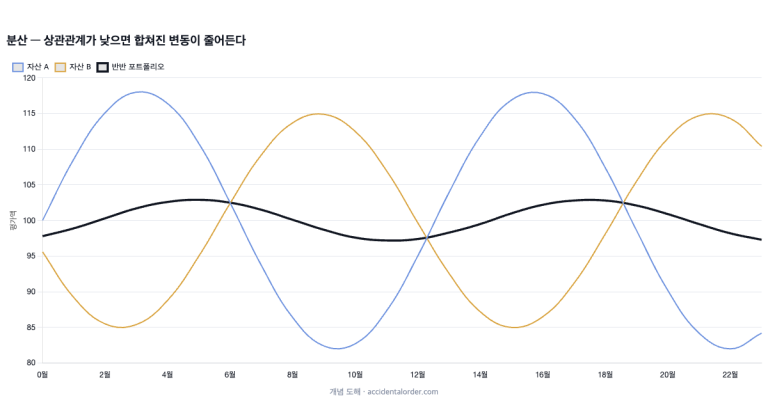
The ingredients of asset allocation are asset classes with differing characters. The crucial point is that each asset’s source of return is different — equities draw on corporate profits, bonds on promised interest, gold on the far side of confidence in money, cash on optionality. When the source of return differs, so does the reaction to the same event.
| Asset class | Source of return | Expected return | Volatility | Relationship with equities |
|---|---|---|---|---|
| Equities | Growth in corporate profits | High | High (15–20%) | — |
| Government bonds | Interest + price gains when rates fall | Lower-middle | Low (3–7%) | Tend to move the other way in a downturn |
| Cash equivalents | Short-term rates | Low | Close to 0 | Unrelated (a cushion) |
| Gold | Real rates, crisis hedge | Middle | Upper-middle (around 15%) | Low correlation in a crisis |
| REITs | Rents + property values | Upper-middle | High | Fairly highly correlated with equities |
One caution. This character sheet describes average tendencies, not laws. The relationship in which “bonds rise when equities fall” in particular is the experience of a low-inflation era, and in a phase led by inflation, as in 2022, equities and bonds fell together. That is why the American 60/40 portfolio recorded its worst year in decades in 2022, at around -17%.
2. The classic allocation formulas
60/40: the reference point
Sixty per cent equities and 40% bonds is the mix that has served as the reference point of asset allocation. You ride the growth of equities while bonds cushion the drawdown. In long-run US data, 60/40 returned somewhat less than 100% equities but had an MDD close to half as deep — in the financial crisis, equities at -57% against roughly -30% for 60/40. It is an exchange of “earning less and hurting far less”.
Age-based: 100 − your age
“Equity weight = 100 − your age” is a rule of thumb built on the logic that the younger you are, the more time you have to recover. At 30 that means 70% equities; at 60, 40%. Some subtract from 110 or 120 to reflect longer life expectancy. What matters is less the formula itself than the principle that the closer the target date, the more you shift towards a mix with a shallower drawdown. It is also a response to the sequence-of-returns risk we saw in the piece on risk — that a fall hurts most when your assets are at their largest.
The three-way split, including cash
Adding cash (or ultra-short bonds) to equities and bonds makes for a powerful mix in practice. Cash is the weakest entry on any table of returns, but it does two jobs. It becomes the ammunition for buying cheaply in a falling market, and as a buffer for living expenses it prevents forced selling. Given that forced selling is precisely the event that destroys compounding permanently, it is more accurate to understand a cash weighting as an insurance premium rather than as a sacrifice of return.
3. Rebalancing: the craft of holding the ratios
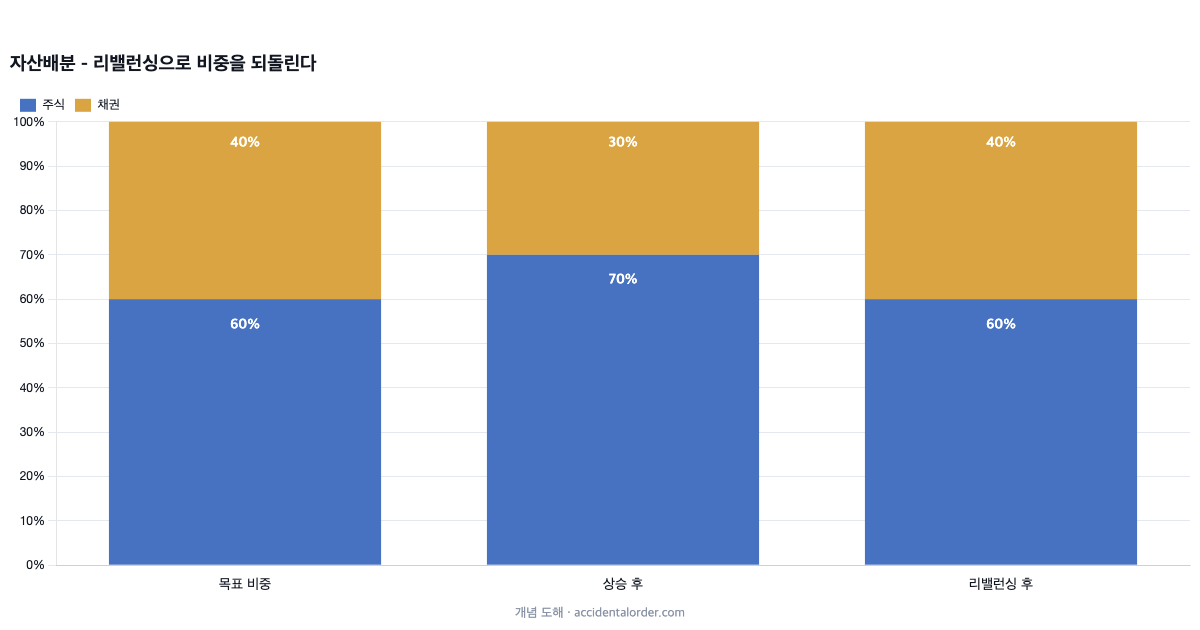
Set the ratios and the market will still break them down on its own. After a year in which equities surge, 60/40 has quietly become 72/28. You changed nothing, yet the account has become a more aggressive account. Rebalancing is the work of returning it to the original ratio.
| Method | Rule | Advantages | Disadvantages |
|---|---|---|---|
| Calendar | Mechanically once a year or twice a year | Simple, low execution burden | Can miss periods of sharp movement |
| Band | When the weight drifts ±5%p from target | Responds to sharp market moves | Requires monitoring |
| Cash flow | Direct new contributions to whatever is short | No selling = tax and cost savings | Too little corrective power if contributions are small |
The real value of rebalancing lies less in improving returns than in automating behaviour. Follow the rule and you end up selling what has risen a lot and buying what has risen less — a device that makes you execute trades in exactly the opposite direction to what emotion demands, without emotion entering into it. That said, frequent rebalancing in a taxable account generates tax on realised gains and eats into the deferral effect we saw in the piece on compounding, so a low frequency of about once a year, or the cash-flow method, is the more substantial choice.
4. The moments when asset allocation fails
In fairness, let us look at the limits too. First, correlations rising in a crisis — in the early stages of the crashes of 2008 and of March 2020, almost every risk asset was sold together. Asset allocation reduces the drawdown; it does not abolish it. Second, an inflationary phase — in a 2022-type market where equities and bonds lose together, the cushioning of a traditional 60/40 did not work. That is why assets such as commodities and inflation-linked bonds are discussed as candidates to fill the gap. Third, the most common failure is not the market but the person — abandoning the allocation plan itself in a crash. Whatever the allocation, it is only an allocation if you can hold it to the end.
5. The order of operations in practice
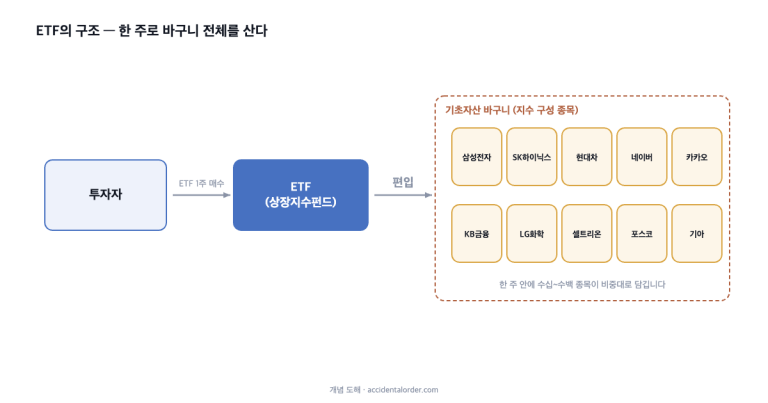
For execution, the following sequence is enough. (1) Fix the MDD you can bear (the piece on risk). (2) Set the equities:bonds:cash ratio that matches that drawdown — as a rough guide, equity weight × equity MDD ≈ the expected drawdown of the whole. (3) Fill each compartment with low-cost index products (picking individual stocks is a later question, and for most people ETFs are enough). (4) Choose one rebalancing rule and put it in the calendar. (5) From then on, keep to the rule rather than to the market.
6. The named portfolios: a map of allocation philosophies
The history of asset allocation contains famous allocations that have stood on the test bench for a long time. Each is a different answer to the question “what is it that you are afraid of?”
| Portfolio | Composition | Design philosophy | Weakness |
|---|---|---|---|
| 60/40 | 60 equities / 40 bonds | The classic balance of growth and defence | Phases where equities and bonds fall together (2022) |
| All Weather (Ray Dalio) | 30 equities / 40 long-dated bonds / 15 intermediate bonds / 7.5 gold / 7.5 commodities | To withstand any economic phase (growth, recession, inflation, deflation) | Lower returns than equity-heavy mixes in a bull market |
| Permanent Portfolio | 25 equities / 25 long-dated bonds / 25 gold / 25 cash | Extreme simplicity and defence | Falls behind in a growth phase |
| Three-fund | Domestic equities / global equities / bonds, in low-cost index form | Simplicity + low cost + global diversification | You have to set the ratios yourself |
| TDF (target-date fund) | Equity weight reduced automatically as retirement approaches | Automation of execution | Internal fees, a one-size-fits-all glide path |
The point is not to pick a winner here. What deserves attention is what they have in common — every one of them gives up on forecasting the future and prepares structurally instead, every one has rules simple enough to maintain for decades, and every one presupposes low-cost implementation. Whichever allocation you choose, having these three properties is a pass mark; without them, a famous name is of no use.
7. A simulation: the same market, three accounts
The effect of allocation shows itself in the passage through a crisis. Let us compare, in simplified form, three hypothetical accounts that started with KRW 100m at the end of 2007 and passed through the financial crisis (2008) and the recovery (2009–2010) — assuming equities follow a global equity index at -40%/+30%/+12% and bonds at +5%/+6%/+5%, with rebalancing once a year.
| Account | End 2008 | End 2009 | End 2010 | Character of the path |
|---|---|---|---|---|
| 100% equities | KRW 60m | KRW 78m | KRW 87m | Maximum drawdown -40%, still below the starting sum after three years |
| 60/40 | KRW 77.2m | KRW 93m | KRW 102m | Drawdown -23%, back to the starting sum in year three |
| 40/60 + rebalancing | KRW 84.4m | KRW 97m | KRW 104m | Drawdown -16%, the shallowest valley |
Notice that this is a contest of paths, not of returns. The 100%-equity account will eventually pull ahead once the next bull market arrives — but that presupposes it was held, unsold, through the -40% stretch. In reality most investors left during that stretch, and for an account that has left, the bull market that follows does not exist. Allocation is not a tool for buying returns; it is a tool for buying the probability of holding on.
8. The lesson of 2022: when an allocation’s premise breaks
2022 added a new chapter to the asset-allocation textbook. In the US, equities (the S&P500) fell about -19% while long-dated Treasuries, the cushion until then, were pushed to around -30% by the spike in rates, and 60/40 posted its worst year in decades at around -17%. The cause was clear — the low inflation that underpinned the inverse correlation between equities and bonds broke down, and a phase arrived in which inflation and interest rates struck both assets at once.
The lesson is not that asset allocation is useless. First, that because correlations depend on the phase, an allocation also needs insurance for inflationary phases (commodities, inflation-linked bonds, short-dated bonds and cash). Second, that within bonds themselves, the longer the maturity (duration) the greater the interest-rate risk — most of the bond losses of 2022 came from long-dated issues. Third, that even in that worst of years, allocated accounts fell less deeply than equities alone and recovered faster the following year. An imperfect shield is still a shield.
Frequently asked questions
Q. I have come into a lump sum. Invest it to the allocation all at once, or in instalments?
Statistically the expected value favours investing immediately — markets have had more up days than down. But if you are not confident you would stick to the plan should a crash arrive right after you invested, spreading it over six to twelve months is a reasonable form of psychological insurance. You are exchanging a few per cent of expected value for a lower probability of abandoning the plan, so choose according to your own weak link (is it greed for returns, or is it fear?).
Q. I have the National Pension and a workplace pension — do those count in the allocation?
Including them is the accurate approach. The National Pension (Korea’s public pension scheme) and workplace retirement pensions are in effect a long-term cash flow with the character of a bond, so someone with substantial pension entitlements has room to carry a larger weight in risk assets. The important habit is to view allocation on the balance sheet of the person, not of the individual account.
Q. If the market is crashing on my rebalancing date, should I postpone?
The principle is to follow the rule. The value of rebalancing lies in removing judgement, and the moment the judgement “this time is an exception” enters, the rule is dead. That said, if for reasons of tax and transaction cost you design the rule itself as a band (act on a ±5%p drift), a crash will usually breach the band, so buying cheaply is executed naturally within the rule.
In closing
Asset allocation is not the craft of forecasting but the craft of humility. Someone who admits they do not know what will rise next year builds, in advance, a structure that cannot be wiped out in any phase. It is not glamorous, but it is the common denominator of the accounts that stay in the market for a long time.
The next article digs into correlation, the technical heart of allocation — The Principles of Diversification: Correlation Is the Heart of It. If it is the instruments that fill each compartment you want, go to the piece on ETFs; if it is the compounding structure that underlies all of this, go to the piece on compounding. Comments are always welcome at the contact address on the About page.
This article is intended as general information and does not recommend the purchase or sale of any particular product. Investment decisions and the responsibility for them rest with the investor.