How to Read Financial Statements: Reading a Company in Three Photographs
Financial statements are the report card in which a company writes out its own household accounts in numbers. At first glance the density of figures and account names is intimidating, but once you have the structure, they are surprisingly simple. Only three statements really matter: the income statement, the balance sheet and the cash flow statement. This article covers, in one pass, what each of the three answers, how to actually open them on DART (Korea’s mandatory electronic disclosure system), and how the three interlock in the real numbers of a single company, Muhak. The individual items are taken up one statement at a time in the articles that follow.
How not to be intimidated — financial statements answer three questions
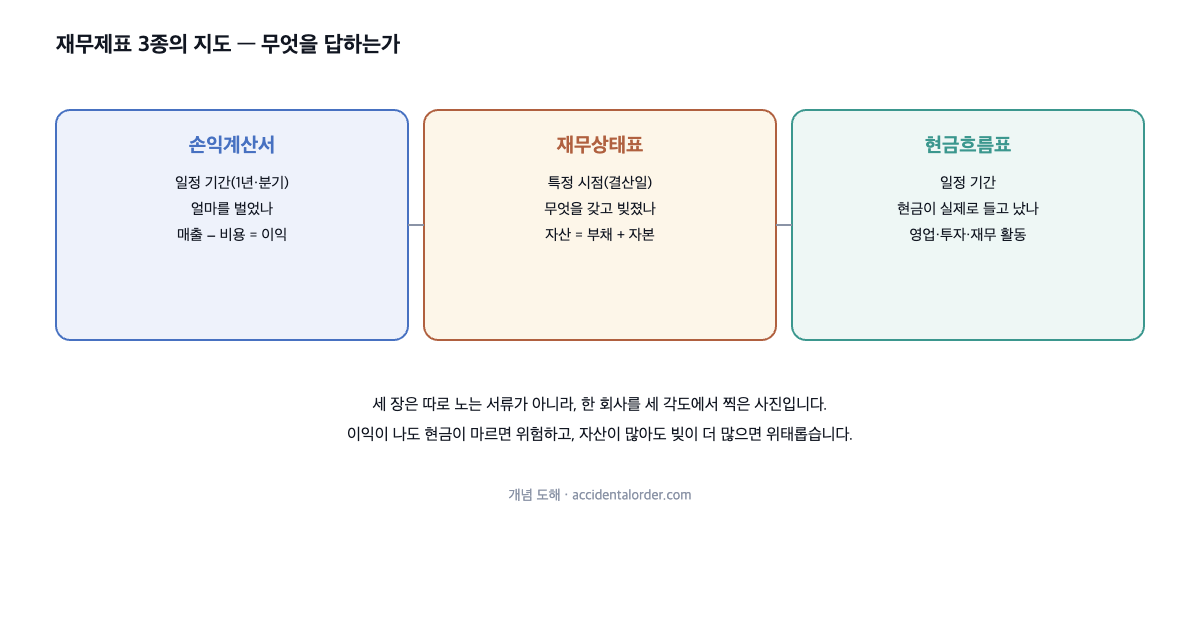
Open a set of financial statements for the first time and dozens of account names pour out; it is easy to be overwhelmed. But every number exists in order to answer one of three questions. “Does this company make money?” (the income statement). “What does it own and how much does it owe?” (the balance sheet). “Does the book profit come in as real cash?” (the cash flow statement). Get that frame into your head and, however unfamiliar an account name is, you can place it by asking yourself “which question is this an answer to?”
To be precise in practical terms, Korean listed companies prepare their financial statements under K-IFRS (Korean International Financial Reporting Standards). A full set consists of the balance sheet, the statement of comprehensive income, the statement of changes in equity, the cash flow statement and the notes. Of these, the three an investor looks at first are the income statement, the balance sheet and the cash flow statement, with the statement of changes in equity and the notes supporting and explaining them. The notes in particular are “the footnotes to the numbers”, containing how those numbers were arrived at, which makes them decisive in practice. The notes are covered separately in a later article.
① The income statement — how much was earned over a period
The income statement shows “how much was earned over the past year (or quarter)”. Revenue comes at the very top, and profit is left over as various costs are subtracted from it stage by stage. So reading an income statement means following “what was shaved off and by how much” from the top line (revenue) to the bottom line (net profit).
In practitioners’ terms, five levels of profit appear in order from the top. First, gross profit is revenue less cost of sales (the money spent directly on making the product), showing the margin on the product itself. Second, operating profit is gross profit less selling and administrative expenses (payroll, marketing, rent and other costs of running the core business), and it represents the strength of the core business. Third, profit before income tax reflects non-operating items such as interest and financial gains and losses; fourth, take tax out and you get net profit; and add items such as valuation gains and losses on available-for-sale securities and you reach the fifth, total comprehensive income.
What investors look at most often is operating profit, because it shows best how much the core business actually earns. The net profit at the bottom, by contrast, also reflects non-operating gains and losses (interest, valuation gains and losses on financial assets, one-off items and so on), so movements unrelated to the core business can be mixed in. If, for example, shares the company holds surge and a large valuation gain is booked, net profit alone leaps while the core business is unchanged. So the sentence “net profit rose” on its own tells you nothing about whether the company has improved. This trap is dealt with in real numbers in the Muhak stock analysis and in the article on capital allocation.
② The balance sheet — what is owned and owed at a point in time
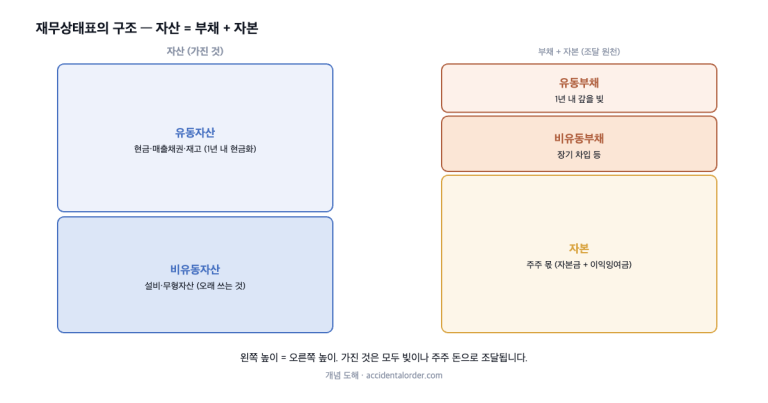
The balance sheet is a photograph taken at a particular “point in time”, the closing date, of what a company holds (assets), how much it owes (liabilities) and how much belongs to shareholders (equity). If the income statement is a video of a “period”, the balance sheet is a snapshot of a “moment”. That is why balance sheet figures always come with a reference date attached, such as “as at 31 December 2024”.
The core identity is assets = liabilities + equity. It means that everything a company holds (assets) was funded either with other people’s money (liabilities) or with shareholders’ money (equity). Assets are further split into current assets, which turn into cash within a year (cash and cash equivalents, trade receivables, inventories and so on), and non-current assets, which do not (tangible assets such as land, buildings and machinery; intangible assets such as goodwill and development costs). Liabilities likewise split into current liabilities, repayable within a year, and non-current liabilities beyond that.
Equity consists of the money shareholders put in (paid-in capital and capital surplus) and the money the company earned and accumulated (retained earnings). Thick retained earnings mean the company has not paid all its profits out as dividends but has built them up inside the business. From here come the representative measure of financial stability, the debt-to-equity ratio (liabilities ÷ equity × 100), and the measure of short-term solvency, the current ratio (current assets ÷ current liabilities × 100). The lower the debt-to-equity ratio, the lighter the debt burden; and a current ratio comfortably above 100% means there is little immediate repayment pressure.
③ The cash flow statement — did cash actually come in and go out?
The cash flow statement is where you check “whether the profit on the books really came in as cash”. Profit is a number computed under accounting rules, so it can differ from the actual bank balance. If goods have been sold and booked as revenue but payment has not yet arrived (trade receivables), profit has been made but cash has not come in. Conversely there are costs, such as depreciation, from which no cash actually leaves. The cash flow statement bridges this gap between accounting and cash, showing only the real movement of cash.
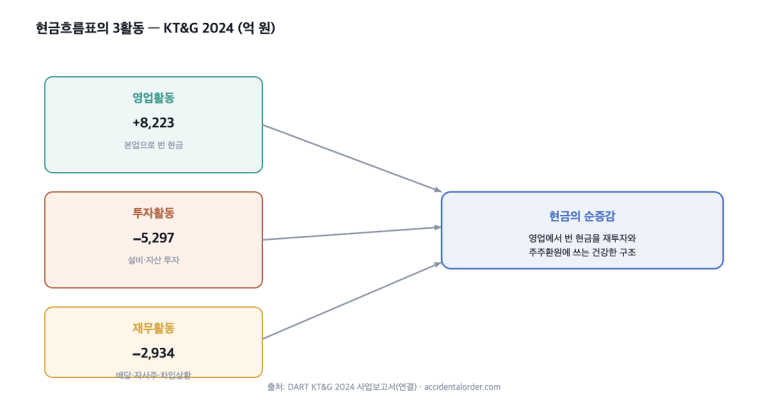
The cash flow statement divides the movement of cash into three activities. Operating cash flow is the cash earned by the core business; it is usually presented under the indirect method, starting from net profit and adjusting for non-cash items (such as depreciation) and changes in working capital. Investing cash flow is the cash that went out and came in through capital investment (capital expenditure), trading in financial assets and the like. Financing cash flow is the cash that moved through funding and shareholder returns: borrowing, repayment, rights issues, dividends and share buybacks.
A healthy company generally produces steady positive cash from operating activities. Subtract capital investment (the capital expenditure part of investing activities) from that and you get free cash flow (FCF), which is the “genuine spare money” a company can use for dividends, buybacks and debt repayment. If profits are being made while operating cash flow stays persistently negative, the quality of those earnings has to be doubted — trade receivables or inventories may be piling up abnormally. This is the starting point for picking up what is commonly called “the smell of window dressing”, and it is covered separately in the article on the cash flow statement.
How to open financial statements on DART
Financial statements are not a paid service; they are disclosures anyone can read free of charge. You open them on the Financial Supervisory Service’s electronic disclosure system (DART, dart.fss.or.kr) in the following order.
- Go to DART (dart.fss.or.kr) and type the company name (for example, Muhak) into the search box at the top.
- From the list of filings, open the annual report (yearly) under periodic disclosures, or a quarterly or half-year report. To see the most recent results, choose the most recent report.
- In the table of contents on the left of the report, find “III. Financial Matters”.
- Beneath it, the consolidated financial statements (the group as a whole) and the financial statements (the company alone, that is, separate) are shown separately. Normally you look at the consolidated set first.
- The income statement, balance sheet and cash flow statement appear in turn, followed by the notes. If you are curious about a particular account, follow its note number for the detailed breakdown.
If you want to skim the numbers quickly, the “key financial information (summary financial information)” table near the front of the annual report is convenient, since it gathers several years of core figures into a single table. But this summary is exactly that — a summary — so exact account names and detailed breakdowns must always be checked in the main financial statements and the notes. In particular, the definition of “operating profit” can be presented slightly differently by company and by industry, so it pays to build the habit of checking that the basis is the same when comparing numbers.
Read ratios and trends, not a single number
People looking at financial statements for the first time easily cling to absolute numbers, as in “revenue of KRW 150bn — is that big?” But absolute numbers alone cannot tell you whether something is good or bad. Revenue of KRW 150bn means something completely different depending on whether it came from a company with KRW 50bn of equity or one with KRW 500bn. So financial statements are always read in ratios (debt-to-equity, operating margin, ROE and so on) and trends (a three- to five-year run). Ratios let you compare companies of different size; trends filter out the accidents of a single year. The calculation of individual ratios and their traps are taken one by one in the later articles of this track (ROE and ROIC; PER and PBR).
A worked example — Muhak’s (033920) 2024 financial statements
Concepts alone are hard to grasp, so let us see how the three statements interlock in a real company’s numbers: the 2024 consolidated financial statements (DART) of the soju and bottled-water maker Muhak.
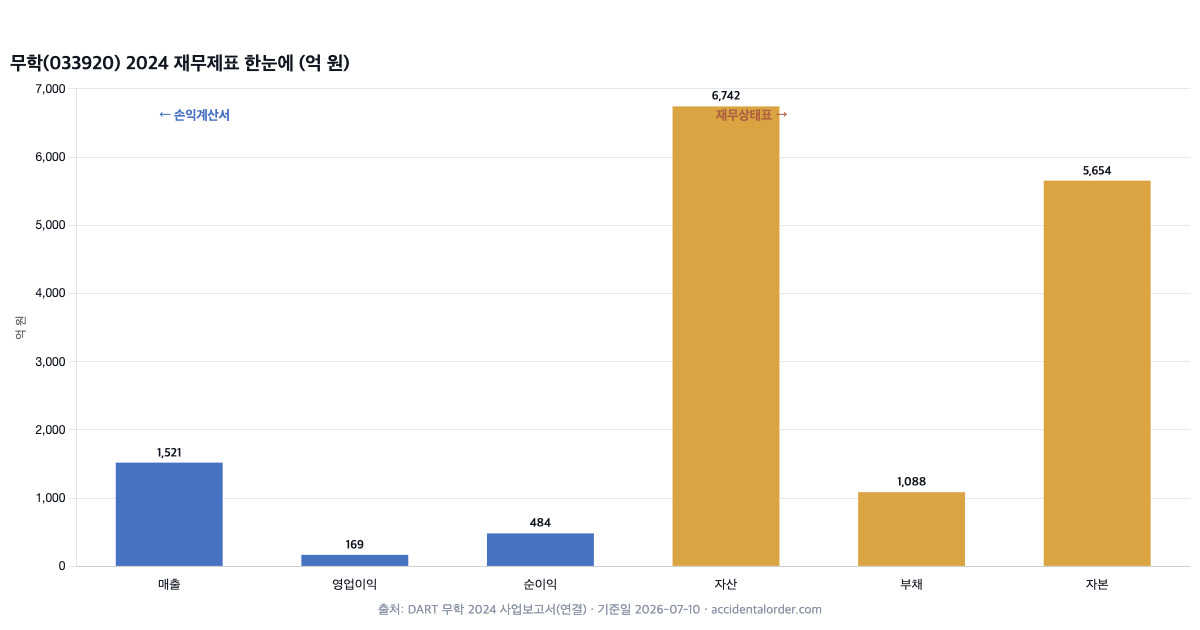
The income statement gives revenue of KRW 152.1bn, operating profit of KRW 16.9bn and net profit of KRW 48.4bn. Net profit (KRW 48.4bn) is far larger than the core business (operating profit of KRW 16.9bn), and much of that gap comes from non-operating items. Beyond its cash and cash equivalents, Muhak holds substantial marketable financial assets, and the valuation and disposal gains and losses on those swing net profit sharply. In other words, it is wrong to read net profit alone and conclude that “the core business earned three times as much”. The strength of the core business is read accurately from operating profit of KRW 16.9bn. This case is dealt with more deeply in the Muhak stock analysis.
The balance sheet gives total equity of KRW 565.4bn and total liabilities of KRW 108.8bn. Adding the two gives total assets of KRW 674.2bn (assets = liabilities + equity). The debt-to-equity ratio is 108.8 ÷ 565.4 × 100 ≈ 19%, which is very low. That means a financially conservative company with almost no debt. What is interesting is that the market capitalisation (about KRW 214.9bn as at 2026-07-10) is far smaller than total equity of KRW 565.4bn. The signal that the company trades at less than half its book net assets can be read straight off a single page of the balance sheet.
Read the three statements together and the story is complete. Muhak’s core business does not earn much (operating profit of KRW 16.9bn), but it has almost no debt (a debt-to-equity ratio of 19%) and thick assets. That said, since net profit is swung by gains and losses on financial assets, the “quality” of its earnings can only be judged by looking at the cash flow statement and the notes as well, not one line of the income statement. Contrasting it with a much larger company sharpens the feel for this. KT&G, for instance, has revenue in the trillions of won, yet we take apart its debt-to-equity ratio, the quality of its earnings and its cash flows within exactly the same framework as at Muhak — the scale differs, but the method of reading does not.
Consolidated versus separate — in one line
Financial statements come in two versions: consolidated and separate. Consolidated combines subsidiaries as though they were a single company; separate covers that company alone. For a group with many subsidiaries, consolidated is closer to the substance; where there are almost no subsidiaries, the two are similar. In cases such as a holding company, where stakes in subsidiaries are the essence of the business, consolidated and separate figures diverge sharply, so you must always check which of the two you are looking at. Since this distinction often proves decisive in real analysis — as with the stocks that go into the analysis ledger — it is covered in a separate article.
Three mistakes beginners commonly make
First, they look only at net profit. Net profit mixes in one-off and financial gains and losses, so the strength of the core business has to be read from operating profit. Second, they look at profit and not at cash. Even with a profit, persistently negative operating cash flow is a danger signal. Third, they look at a single year. Financial statements have to be read across at least three to five consecutive years before trends and volatility become visible. The good habit is always to read “three statements, several years, in ratios, together”. That one habit is what separates the beginner from the experienced hand.
The order in which to read financial statements — a five-minute checklist
- The revenue and operating profit trend (three to five years): is the core business growing and holding, or turning down?
- Operating margin: operating profit ÷ revenue. Is the margin stable?
- Debt-to-equity and current ratios: are the finances solid, and is there any short-term repayment pressure?
- Operating cash flow: is the profit coming in as cash (is it moving in the same direction as profit)?
- The cause of the gap between net profit and operating profit: if the gap is large, check the non-operating items in the notes.
Depreciation and working capital — two concepts beginners miss
There are two concepts you are bound to meet when reading financial statements, and which beginners often skip over. The first is depreciation. Long-lived assets such as plants and machinery are not written off as an expense in the year of purchase; they are recognised as a cost spread over their useful life. When that happens the income statement records a cost, but no cash actually goes out. So the cash flow statement adds that depreciation back to net profit, and this adjustment is the classic reason why operating profit and operating cash flow diverge.
The second is working capital. Working capital is roughly “trade receivables + inventories − trade payables”, the money tied up in order to run the business. Even if revenue grows quickly, if receivables and inventories swell along with it, you can end up in a situation where profit is being made while cash dries up. That is why, when looking at a growing company, you have to watch working capital and operating cash flow as well as profit. These two concepts are revisited with real cases in the article on the cash flow statement.
Financial statements stand on the roots of investing study
Reading financial statements is not a detached skill; it connects to the basic fitness of investing. If a company does not pay all its profit out as dividends but accumulates it as retained earnings and reinvests it, that compounding effect creates long-term value — the principle covered in what compounding is shows up as retained earnings on the balance sheet. The debt-to-equity ratio on the balance sheet, meanwhile, shows how much risk a company is carrying, and that is the corporate version of the volatility and maximum drawdown covered in understanding investment risk. However good a single company’s finances, putting everything into one place is dangerous, which is why the principles of asset allocation are needed alongside. Financial statements are the window through which you see how these basics are realised in a real company.
Frequently asked questions (FAQ)
Q1. Where can I see financial statements for free?
Anyone can see them free of charge on the Financial Supervisory Service’s electronic disclosure system (DART, dart.fss.or.kr). Search by company name, open the annual or quarterly report, and check under “III. Financial Matters”. Services such as Naver Finance also provide summaries, but the original DART filing is the reference for exact accounts and notes.
Q2. If I could only look at one of the three, which would it be?
If forced to pick one, many practitioners choose the cash flow statement (especially operating cash flow), because profit has accounting estimates mixed into it while cash is relatively hard to manipulate. But the habit of looking at only “one” is itself dangerous, so in practice all three must be read together.
Q3. Should I look at consolidated or separate?
For a company with subsidiaries, take the consolidated set as the default, since it shows the substance of the whole group. Where there are almost no subsidiaries, consolidated and separate are similar. Where the structure is unusual, as with holding companies or financial businesses, the difference between the two is large, so check the “subsidiaries and associates” items in the notes as well.
Estimates are mixed into the numbers — the limits of accounting
Finally, a word about the attitude to take towards financial statements. Accounting is a record of facts and at the same time a collection of estimates. Over how many years to depreciate tangible assets, how much to set aside for receivables that look uncollectable (the bad debt allowance), how to value inventories, what fair value to recognise for the financial assets held — management’s judgement and assumptions enter into every one of these. So even for identical businesses, the profit figure can differ according to accounting policy and estimates.
This does not mean financial statements are useless; it means they should be treated not as “absolute truth” but as “the best-organised estimate available”. And where is the basis for those estimates written down? In the notes. Depreciation methods, revenue recognition criteria, the classification of financial assets, related-party transactions — every assumption that moves the numbers is in the notes. That is why the more experienced the investor, the faster they skim the numbers in the main statements and the longer they linger in the notes. It is also why this track devotes a separate article, on audit reports and the notes, to how to read them. And it is the same attitude behind our practice of citing the source (DART) for every figure and leaving mistaken judgements in the analysis ledger — numbers have to be handled humbly.
Summing up
Financial statements are three photographs. The income statement shows performance over a period, the balance sheet the state of things at a point in time, and the cash flow statement the actual movement of cash. Reading the three together, over several years, in ratios and trends, is the starting point of fundamental analysis. The next article takes the first of them, the income statement, and works through it line by line from revenue to net profit.
Investing study · fundamental analysis. This article is for information purposes and is not a recommendation to buy or sell any particular stock. Figures are based on the original DART disclosures and may change after the time of writing (July 2026).