Understanding Investment Risk: Volatility and Maximum Drawdown (MDD)
Talk of returns is everywhere. Which stock multiplied several times over, how much some asset is up this year. Yet the reason so few people actually end up holding those returns lies mostly on the risk side. They sold before the gain arrived because they could not sit through the pain, or they went in at a size they could not withstand and were forced out of the market altogether. That is why, in this series, the subject that follows compounding is risk.
This article turns the vague feeling of “that looks risky” into two measurable numbers — volatility and maximum drawdown (MDD). We will take, in order, what each number means and how it is calculated, the values actually recorded in real markets, and how those numbers ought to feed back into the design of your own account.
1. Defining risk: not the chance of losing, but dispersion
In everyday language risk is “the chance of losing money”, but finance defines it more broadly — the degree to which outcomes depart from expectations, that is, the dispersion of the distribution of returns. An asset you expect to return 7% on average may in any single year deliver +30% or -20%. The wider that dispersion, the greater the chance your plan goes off course, and a plan that has gone off course invites bad decisions (panic selling, chasing a rally). The purpose of risk management is not to drive the possibility of loss to zero, but to keep dispersion inside the range you personally can absorb.
2. Volatility: the yardstick for everyday swings
Volatility is the standard deviation of returns. An asset with annual volatility of 15% can be read as one where, in roughly two years out of three, the return lands within ±15 percentage points of the average (assuming a normal distribution). Years that fall outside twice that band, ±30%, come around about once in twenty. A rough sense of annual volatility by asset class looks like this.
| Asset | Annual volatility (approx.) | Notes |
|---|---|---|
| Bank deposits | 0% | Fixed in nominal terms |
| Developed-market government bonds | 3–7% | Higher the longer the maturity |
| Global equity indices | 15–20% | Near the long-run S&P500 average |
| Individual large caps | 25–40% | Wide variation by name |
| Individual small caps and theme stocks | 40%+ | Higher the thinner the liquidity |
| Bitcoin | 60–80% | Three to four times equities |
The practical meaning of volatility is a psychological cost. Put KRW 100m into an asset with 20% annual volatility and millions of won move in a single day. Few people can watch that day after day and keep their composure. To build volatility into the design of an account is to treat your own reactions, rather than a market forecast, as a design variable.
3. Maximum drawdown (MDD): the yardstick for the worst stretch
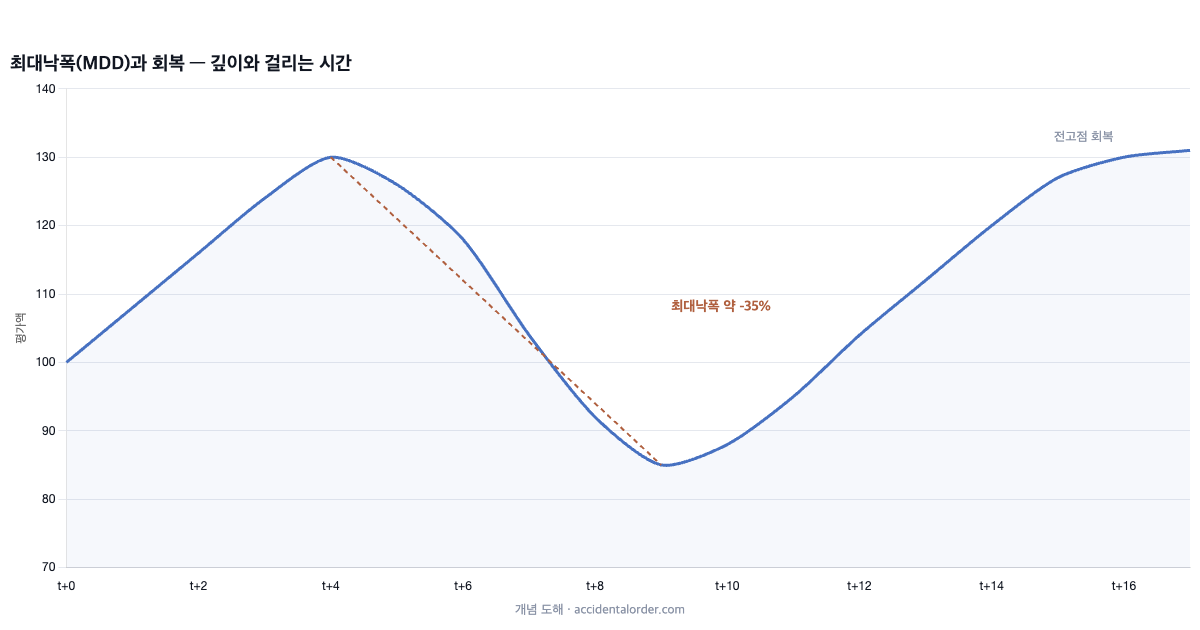
MDD (maximum drawdown) is the deepest fall from peak to trough over a given period. If volatility is the ordinary weather, MDD is the worst typhoon on record for that region. Here are the values real markets have actually posted.
| Event | Asset | Fall from peak | Time to recover |
|---|---|---|---|
| Dot-com bust (2000–02) | Nasdaq Composite | about -78% | about 15 years |
| Global financial crisis (2007–09) | S&P500 | about -57% | about 5 and a half years |
| Global financial crisis (2007–08) | KOSPI (Korea’s main-board index) | about -54% | about 2 and a half years |
| Covid crash (Feb–Mar 2020) | S&P500 | about -34% | about 5 months |
| Rate spike (2022) | S&P500 | about -25% | about 2 years |
| Rate spike (2022) | US long-dated Treasury index | about -30%+ | ongoing (as at the time) |
Two things stand out. First, even long-dated government bonds — the assets labelled “safe” — posted equity-scale drawdowns when rates spiked, which is exactly why you have to look at the numbers rather than the label. Second, what is more frightening than the depth of the fall is the length of the recovery. An investor who bought the Nasdaq at the dot-com peak needed 15 years to get back to par. Whether the money and the temperament could survive that span is what actually separated success from failure.
4. The asymmetry of loss: why drawdown control comes first
The deeper the drawdown, the faster the return needed to recover accelerates. Making back the same percentage you lost does not get you back to par.
| Size of loss | Return needed to get back to par | Time at 7% a year |
|---|---|---|
| -10% | +11% | about 1.6 years |
| -20% | +25% | about 3.3 years |
| -30% | +43% | about 5.3 years |
| -40% | +67% | about 7.5 years |
| -50% | +100% | about 10.2 years |
| -70% | +233% | about 17.8 years |
On top of this comes volatility drag. An account that gains +50% in year one and loses -50% in year two has an arithmetic average of 0%, yet in reality has lost 25%. Mathematically, the realised compound return is approximated by “arithmetic average − volatility²/2”. Even if you average 10% a year, volatility of 20% leaves actual compound growth at a little over 8%, and volatility of 40% drags it down to 2%. That is why, for the same average, the choppier of two paths structurally delivers weaker long-run performance.
5. Translating the two numbers into account design
Start by fixing the MDD you can live with
Design runs backwards. Not “how much do I want to make”, but “how far can the account fall before I abandon the plan”. If the answer is -20%, then a design that puts your entire net worth into an equity index with a historical MDD of -55% is self-contradictory from the outset. You either cut the equity weight to 40% or below (an overall drawdown of roughly -22%), or mix in assets whose drawdowns are shallower.
Where to find the numbers
For funds and ETFs, volatility and MDD are disclosed on the manager’s pages and by rating agencies (Zeroin, Morningstar and the like). For individual stocks or whole portfolios, feeding historical data into a portfolio backtesting tool (Portfolio Visualizer, for instance) returns both figures directly. There is no guarantee the future resembles the past, but a historical MDD can serve as a floor — a “brace for at least this much” line.
The toolbox for handling risk
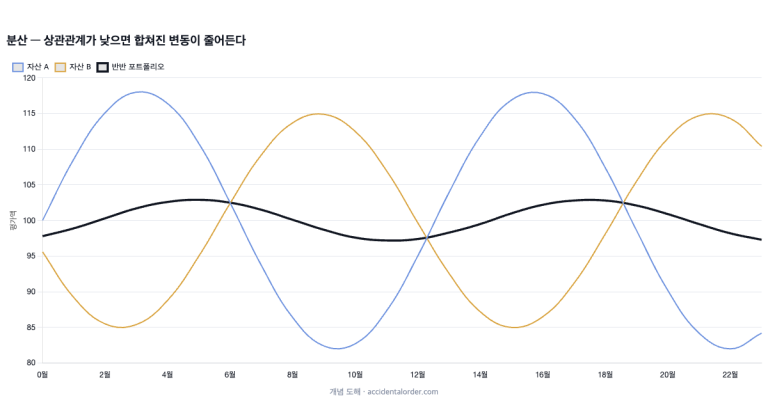
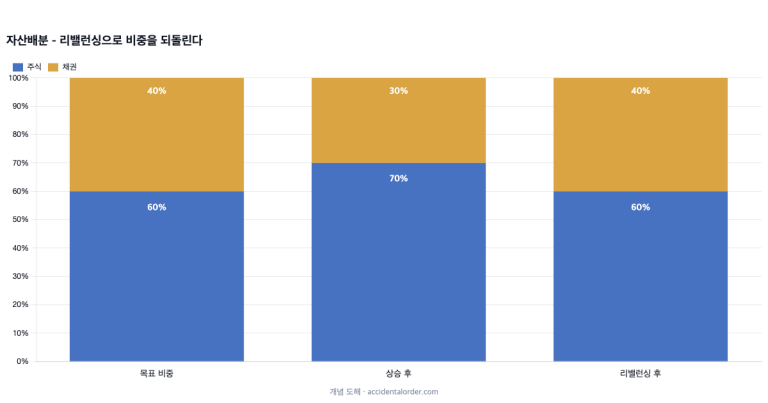
In the end there are four tools for dealing with drawdown: asset allocation and diversification, which use correlations between assets to damp the swings themselves; a cash weighting that becomes ammunition in a falling market; and position sizing, which keeps you invested only at a scale you can absorb in the first place. Tactics such as stop-loss rules come after that — no tactic can rescue an account whose structure is wrong.
6. Common misconceptions about risk
“Invest for the long term and risk disappears” is only half true. The longer the holding period, the narrower the dispersion of the annualised return — but the dispersion of the final amount actually widens. Long-term investing is not a spell that abolishes risk; it is a device that buys time for a good expected value to be realised. “Low volatility means safe” is dangerous too. Low-volatility assets collapsing all at once in a liquidity crisis (certain bond-type products in 2008) is a pattern that keeps repeating. Volatility is only a summary of the past, not a warranty on the future.
7. Working through a volatility calculation by hand
To nail the concept down, let us walk through an actual calculation. Suppose an asset’s annual returns over the past five years were +21%, -9%, +14%, +30% and -6%. The average is +10%. Each year’s departure from that average is +11, -19, +4, +20 and -16 percentage points. Square those deviations and average them and you get about 218; its square root, about 14.8%, is this asset’s annual volatility (standard deviation). An asset with the same +10% average that had moved between +8% and +12% every year would have volatility of under 2% — same average, an entirely different ride.
It is also worth knowing the conversion rule practitioners use constantly. Multiply the standard deviation of daily returns by √252 (the square root of the number of trading days in a year, about 15.9) and you have an approximation of annual volatility. An asset that swings 1% a day has annual volatility of about 16%; at 2% a day, about 32%. In effect, the size of your account’s daily moves tells you the risk grade of the whole account.
8. Risk-adjusted return: the Sharpe ratio as a common language
Look only at return and you miss risk; look only at risk and you miss return. The Sharpe ratio ties the two into one number — (asset return − risk-free return) ÷ volatility. It means “how much excess return did you receive per unit of risk”, and it is used as a common language for comparing funds and strategies.
| Portfolio | Annual return | Volatility | Sharpe ratio (risk-free assumed at 3%) |
|---|---|---|---|
| A: aggressive | 12% | 25% | 0.36 |
| B: balanced | 8% | 10% | 0.50 |
| C: defensive | 5% | 4% | 0.50 |
| D: high-volatility theme | 15% | 45% | 0.27 |
D ranks first on return but last on the Sharpe ratio — meaning that return was inefficient relative to the risk borne to obtain it. The real reason a D-type account is dangerous for a long-term investor is that, in the deep drawdown stretches 45% volatility will produce, most people abandon their plan. Note that the Sharpe ratio has the limitation of penalising upside swings as well, which is why variants are also used: the Sortino ratio, which counts only downside swings, and the Calmar ratio, which divides by MDD. Whichever measure you use, the message is the same — a return must always be read alongside its risk.
9. Case study: 2008, the moment the numbers became a life
Let us turn the statistics into something felt. At the end of October 2007 the KOSPI hit an all-time high of 2,064 points. Exactly a year later, at the end of October 2008, the low was 938 — about -55% from the peak. Here is what the experience actually looked like for an investor who put KRW 100m into the KOSPI near that peak.
| Date | Account balance (approx.) | State of mind (the shared narrative in accounts from the time) |
|---|---|---|
| Oct 2007 (entry) | KRW 100m | The peak of the “you’re a fool if you’re not in a fund” mania |
| Jan 2008 | KRW 86m | “It’s a correction, it’ll recover soon” |
| Jul 2008 | KRW 74m | Unease sets in, thoughts of averaging down |
| Oct 2008 | KRW 46m | Fear. Queues to redeem, the news is all financial crisis |
| Sep 2009 | KRW 73m | A rebound, but “I’ll sell when I’m back to par” |
| Jan 2011 | Back to KRW 100m | Three years and two months after the peak |
There are three lessons in that table. First, that the number -55% is the experience of sitting through twelve months with KRW 54m gone from the account. Second, that the worst selling happens near the bottom (October 2008 to early 2009) — redemptions from Korean equity funds were in fact concentrated in the rebound that followed the low. Third, that even so, the investor who did not sell was back to par in three years and two months, and the investor who bought more at the low made a large gain. In the same market, facing the same drawdown, what separated the outcomes was not forecasting ability but a size and a cash cushion designed in advance to be bearable.
Frequently asked questions
Q. If I pick only low-volatility stocks, does that give me a safe portfolio?
Only partly. If low-volatility names are highly correlated with one another, the drawdown of the portfolio as a whole can still be deep; conversely, a high-volatility asset with low correlation to what you already hold may actually reduce total risk. Risk has to be measured at the level of the portfolio, not the individual holding.
Q. Should assets with a large MDD be avoided outright?
No. MDD is not a criterion for “assets to avoid” but a criterion for “the weight you can hold”. Equities with a historical MDD of -55% still contribute a manageable -16% to -17% at the account level if they make up only 30% of it. Separating the question of which assets to choose from the question of what weight to give them is the essence of risk management.
Q. How often should risk measures be checked?
Checking the measures themselves in line with your rebalancing cycle (once or twice a year) is enough. What needs checking daily is not the measures but whether your principles are being kept. Frequent checking, if anything, invites over-reaction to short-term swings — fixing the interval at which you look is itself a risk-management tool.
In closing
To sum up. Risk is not a feeling but two numbers. Volatility measures the everyday swings, MDD the depth of the worst case. And because of the asymmetry of loss, long-run performance is governed not by your best year but by how shallowly you pass through your worst stretch. The first question in designing an account must always be “how far down can I hold on?”
If you want the concrete design work that builds staying power, two articles follow on from this one — the principles of asset allocation, on setting the ratios between assets, and the principles of diversification, on the craft of mixing itself. If it is the engine on the return side that interests you, reading the piece on compounding first is a good option. Questions, or subjects you would like covered, can be sent to the contact address on the About page.
This article is intended as general information and does not recommend the purchase or sale of any particular product. Investment decisions and the responsibility for them rest with the investor.