What Compounding Is: The Structure of Returns That Time Builds
When people ask me where to start studying investing, I always give the same answer. Not how to pick stocks, not how to read charts — start with compounding. Compounding is the rule of the game of investing itself, and once you understand that rule numerically, the yardstick for every choice that follows — when to start, what to hold, when to sell — changes.
Here we push the one-line piece of common sense — “interest earning interest” — all the way through with tables and simulations, and check exactly what each of the four forces that break compounding in practice — withdrawing early, large losses, costs and taxes — is worth. The calculations are all simple models, but they are enough to set a direction. Let us start with a straightforward example.
A starts investing at thirty-eight, B at twenty-eight. Suppose both put in KRW 500,000 a month at a 7% annual return until they turn sixty. B pays in only ten years’ worth more than A — KRW 60m more. Yet at sixty, A’s account holds about KRW 400m and B’s about KRW 900m. The extra KRW 60m paid in has come back as a KRW 500m gap. What creates this seemingly unreasonable gap is compounding, and that is the subject of this article.
Compounding appears on the first page of every investment textbook, but most people learn it as the single line “interest earning interest” and move on. In this article we push that one line all the way through with numbers. How compounding is calculated exactly, why time is decisive, and what each of the four enemies of compounding in practice — withdrawing early, large losses, costs and taxes — is worth, set out with tables.
1. The arithmetic of compounding: multiplication, not addition
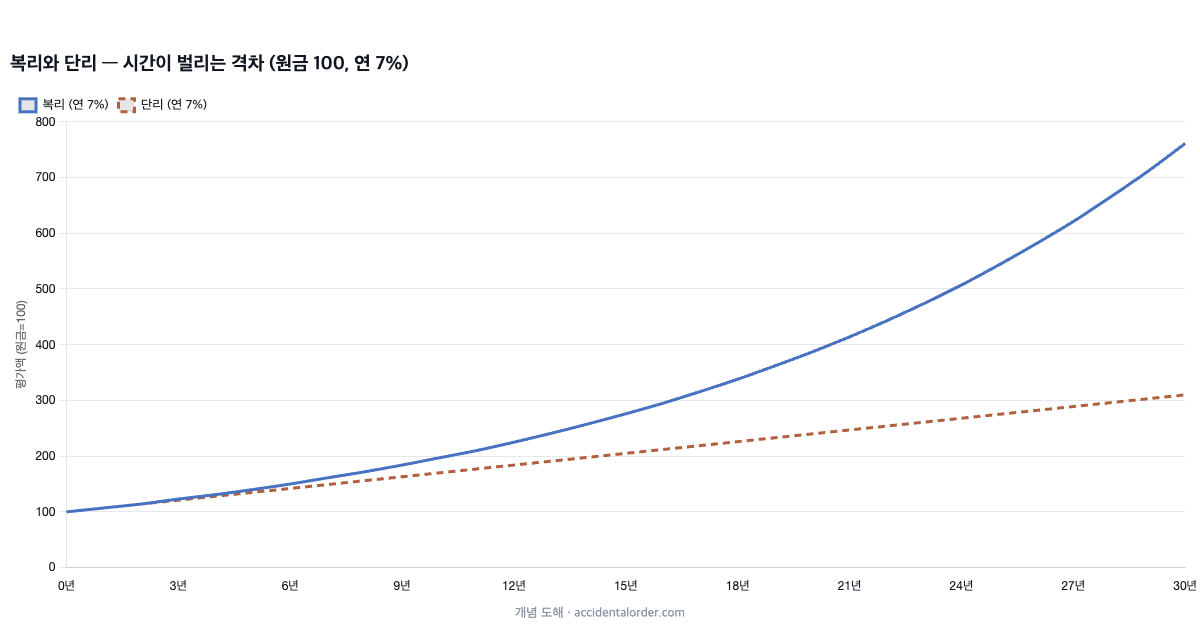
With simple interest, only the principal earns interest. With principal P, an annual rate r and a period of n years, the final amount is P × (1 + r×n) — it grows by addition. With compound interest, the whole accumulated amount earns interest again each year. The final amount is P × (1+r)ⁿ — it grows as a power. The formula is simple, but the fact that it is a power changes everything.
Here is the difference between the two methods for KRW 10m invested at 7% a year.
| Period | Simple interest | Compound interest | Gap |
|---|---|---|---|
| 10 years | KRW 17m | about KRW 19.67m | KRW 2.67m |
| 20 years | KRW 24m | about KRW 38.7m | KRW 14.7m |
| 30 years | KRW 31m | about KRW 76.12m | KRW 45.12m |
| 40 years | KRW 38m | about KRW 149.74m | KRW 111.74m |
What deserves attention is the speed at which the gap widens. Over the first ten years the gap is only KRW 2.67m, but in the single decade between year 30 and year 40 the compounded assets grow from KRW 76.12m to KRW 149.74m — more growth than in the whole of the preceding thirty years. The compounding curve is dull at the front and explosive at the back. That “dull front section” is precisely why so many people never feel compounding working and give up halfway.
2. The rule of 72: a calculator in your head
The time it takes for assets to double can be estimated by dividing 72 by the annual return (%). It is an approximation, but a fairly accurate one across the everyday range of returns.
| Annual return | Rule of 72 | Exact value |
|---|---|---|
| 2% | 36.0 years | 35.0 years |
| 4% | 18.0 years | 17.7 years |
| 7% | 10.3 years | 10.2 years |
| 10% | 7.2 years | 7.3 years |
| 15% | 4.8 years | 5.0 years |
| 20% | 3.6 years | 3.8 years |
This table tells you two things. First, a difference of a few percentage points in return changes the “time to double” by years. Second, it can be used in reverse — if a product promises “double in ten years”, it is promising 7.2% a year compounded, and “double in three years” is promising 24% a year. When you meet a proposal of the latter kind, this one calculation makes an excellent fraud detector.
3. The asymmetry of time: when you start beats how much you put in
Let us extend the opening example of A and B into a table. These are the outcomes by starting age for someone paying in KRW 500,000 a month at 7% a year (converted to monthly compounding) until sixty.
| Starting age | Investment period | Principal paid in | Expected assets at 60 |
|---|---|---|---|
| 25 | 35 years | KRW 210m | about KRW 900m |
| 35 | 25 years | KRW 150m | about KRW 410m |
| 45 | 15 years | KRW 90m | about KRW 160m |
The difference in principal paid in between starting at 25 and starting at 35 is KRW 60m, but the difference in final assets is about KRW 490m. To fill that gap with money, the later starter would have to pay in not KRW 500,000 a month but more than KRW 1.1m. In compounding, time is the most expensive resource to buy with money. That is why the question “when should I start?” has a far simpler answer than “how much should I put in?” — the earliest possible moment, which is now.
By the same logic, there is something here for anyone who feels they are already too late. Even starting at 45, fifteen years of compounding turns KRW 90m of principal into KRW 160m. The optimal starting point for compounding is the past, but the second-best starting point is always today.
4. Reinvestment: the switch that makes compounding work
Compounding is not handed to you automatically. It only works if the money that has accumulated stays in the account and goes to work again. The most common way of switching it off is to spend dividends and interest the moment they arrive.
The power of dividends is greater than people expect. Suppose you hold an asset for thirty years whose price rises 5% a year and which pays a 2% dividend. Reinvest every dividend and you compound at 7% a year, ending at 7.6 times the principal; take the dividends out and spend them each time and you compound at 5%, ending at only 4.3 times (even adding back the dividends withdrawn, a large gap remains). A mere 2 percentage points makes a difference of 76% against 43% in final assets thirty years later — roughly 1.8 times. Long-run analyses of the US S&P 500 point to the same thing: a substantial part of total return, which you miss if you look only at the index’s price gain, comes from dividend reinvestment.
5. The mathematics of loss: compounding’s most frightening face
The fact that compounding is multiplication applies equally to losses. And here there is a cruel asymmetry. Earning back the same percentage you lost does not get you back to even.
| Size of loss | Return needed to break even |
|---|---|
| -10% | +11% |
| -20% | +25% |
| -30% | +43% |
| -40% | +67% |
| -50% | +100% |
| -60% | +150% |
| -70% | +233% |
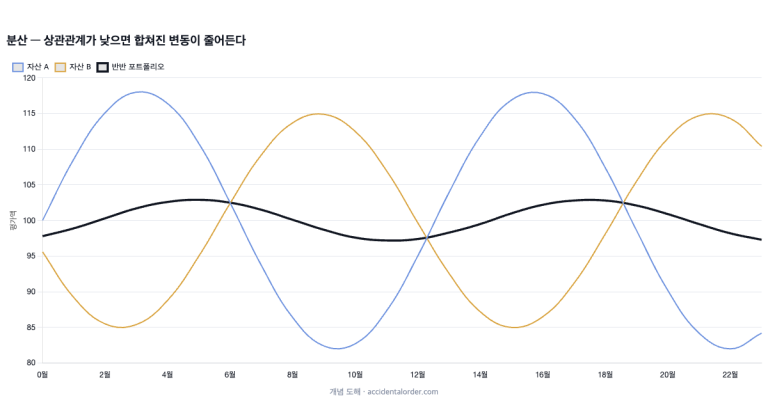
Think of an account that records +50% in its first year and -50% in the next. The arithmetic mean return is 0%, but the account itself is 1.5 × 0.5 = 0.75 — it has lost 25%. The greater the swings, the wider the gulf between the arithmetic mean and the actual compound return (the geometric mean). This is volatility drag, and it is the mathematical reason why an account that swings between spectacular gains and deep losses cannot beat a dull-looking one over the long run.
The conclusion is clear. Within a compounding structure, avoiding large losses ranks higher than chasing large gains. Warren Buffett’s maxim — “Rule No. 1: never lose money. Rule No. 2: never forget rule No. 1” — is not a piece of moralising but a summary of the table above.
6. Costs: a minus that compounds in silence
Fees and charges look trivial in any single year. But costs come out every year, from the whole of your assets, whether the market rises or falls. In other words, the cost itself compounds. Take KRW 10m in a product returning 7% a year gross over thirty years, and vary only the annual charge.
| Annual charge | Net return | After 30 years | Versus best option |
|---|---|---|---|
| 0.2% | 6.8% | about KRW 71.95m | — |
| 1.0% | 6.0% | about KRW 57.43m | -20% |
| 2.0% | 5.0% | about KRW 43.22m | -40% |
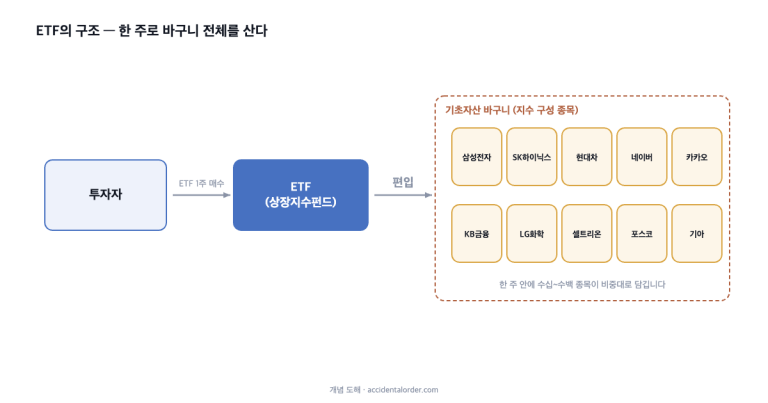
A difference of 1.8 percentage points in the annual charge carved 40% off the final assets thirty years later. Whatever the product — fund, ETF or wrap account — in long-term investing the total expense ratio is a “confirmed negative compounding”. Nobody can guarantee future returns, but costs can be fixed today — which makes them one of the few variables a long-term investor can control.
7. Tax: when you are taxed changes the compounding
Tax is a cost too, but it has one distinctive property: the result changes depending on when it is taken. If gains are taxed every year, the principal available for reinvestment shrinks by that much and the compounding engine gets smaller each year. If taxation is deferred to the point of sale, on the other hand, even the money that will eventually go to tax keeps working for you in the meantime.
As a simplified example, assume a 7% annual return and a 15.4% tax rate: if it is taxed every year, the effective return becomes about 5.9% and KRW 10m becomes about KRW 56m after thirty years. Under the same conditions, if tax is levied only once at the end, the after-tax figure is about KRW 66m — a difference of about KRW 10m even though the tax rate is identical. This is where the essential value of tax-advantaged accounts such as pension savings accounts, IRPs (individual retirement pensions) and ISAs (individual savings accounts) — Korea’s tax-favoured investment wrappers — lies. Before any reduction in the rate, they are devices for deferring the moment of taxation so that the compounding engine can run intact. (Specific rates and limits change frequently as the rules are revised, so please check the current regulations before acting.)
8. Compounding in the real world: markets are not straight lines
Every table so far rests on the assumption of “exactly 7% every year”. Real markets do not move that way. Some years bring +25%, others -15%, and it is only the long-run average that converges on 7%. This fact has two practical implications.
First, the “explosive section” of the compounding curve is a probabilistic tendency, not a reserved future. You may start out trusting a thirty-year average of 7% and still find the first ten years below average. A plan has to be built to withstand not just the average return but the variation around it. Second, a fall hurts most when your assets are at their largest, such as just before retirement (sequence-of-returns risk). The same -30% means a very different absolute loss on KRW 100m than on KRW 900m. The classic advice to increase the weight of low-volatility assets as your target date approaches is a response to this problem.
9. A practical checklist
Compressed into rules of action, the contents of this article come to the following.
- Do not put off starting — time is the most expensive resource in compounding.
- Set reinvestment as the default for dividends, interest and gains.
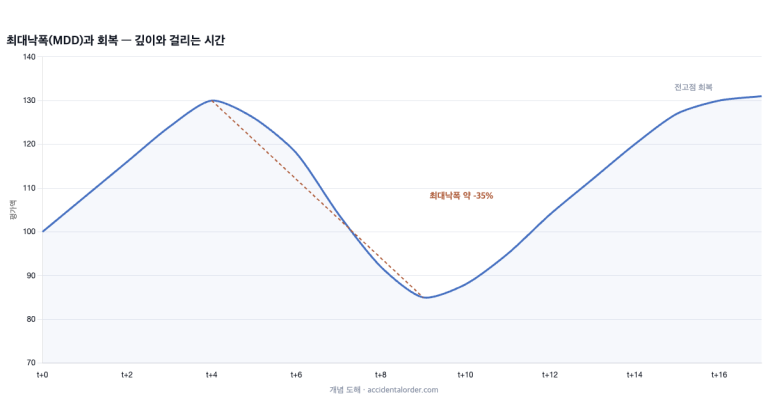
- Whatever the asset, check its historical maximum drawdown before buying, and hold only a weight you can endure.
- Read a total expense ratio of 1% a year or more as “-20% after thirty years”.
- Fill tax-advantaged accounts (tax deferral) before ordinary accounts.
- Fix an interval for checking your account, so that you are not elated and dejected by short-term performance.
Frequently asked questions
Q. How does compounding on deposits differ from compounding on investments?
The structure is the same; the raw material differs. A deposit pays a fixed rate, so the curve is smooth but its slope is low, and subtracting inflation makes the real slope lower still. Investment has a higher slope but the curve lurches about. Either way the engine — reinvestment plus time — is identical.
Q. I have no lump sum. Does compounding mean anything for me?
Regular instalment investing is the standard way to use compounding. As the table in section 3 shows, even KRW 500,000 a month reaches the hundreds of millions of won given enough time. Continuity of contributions and the starting point decide the outcome far more than the size of the amount.
Q. I am sitting on a loss. Has compounding broken down?
No. Compounding is not an “upward-sloping curve” but a “multiplicative structure”. Declines are part of that structure, and what matters is avoiding irrecoverable losses (excessive concentration, leverage, forced selling). The recovery table in section 5 is your reference line.
References
Jeremy Siegel, Stocks for the Long Run — very long-run return data by asset class. / John Bogle, The Little Book of Common Sense Investing — the effect of costs on long-term returns. / All calculations in the text are simple models on a nominal-return basis; actual results will differ with inflation, tax rules and transaction costs.
In closing
That is the structure of compounding. Reduced to a single sentence: compounding is a game of time and discipline before it is a game of returns. Start early, do not take out what has accumulated, avoid large losses and high costs. It is these three things, not any dazzling technique, that build the back end of the curve.
A further question naturally remains: how do you endure the swings in those returns? That question is dealt with in Understanding investment risk: volatility and maximum drawdown (MDD), and the design work of reducing the swings themselves continues in The principles of asset allocation and The principles of diversification. If you have questions, or a subject you would like covered, let me know via the contact details on the About page. We continue in the next article.
This article is for general information purposes only and does not recommend the purchase or sale of any particular product. Investment decisions and the responsibility for them rest with the investor.