What Are Overlooked Stocks: The Opportunity and the Traps in What the Market Ignores
The spotlight in the stock market is not shared equally. More than 2,600 companies are listed on KOSPI and KOSDAQ (Korea’s main board and its growth-company market), but only a fraction of them are covered regularly by brokerage research, and fewer still are covered by the news and YouTube. The rest — companies without a single analyst report, whose daily turnover amounts to a few hundred million won — make up the majority of the market. These are what we call overlooked stocks.
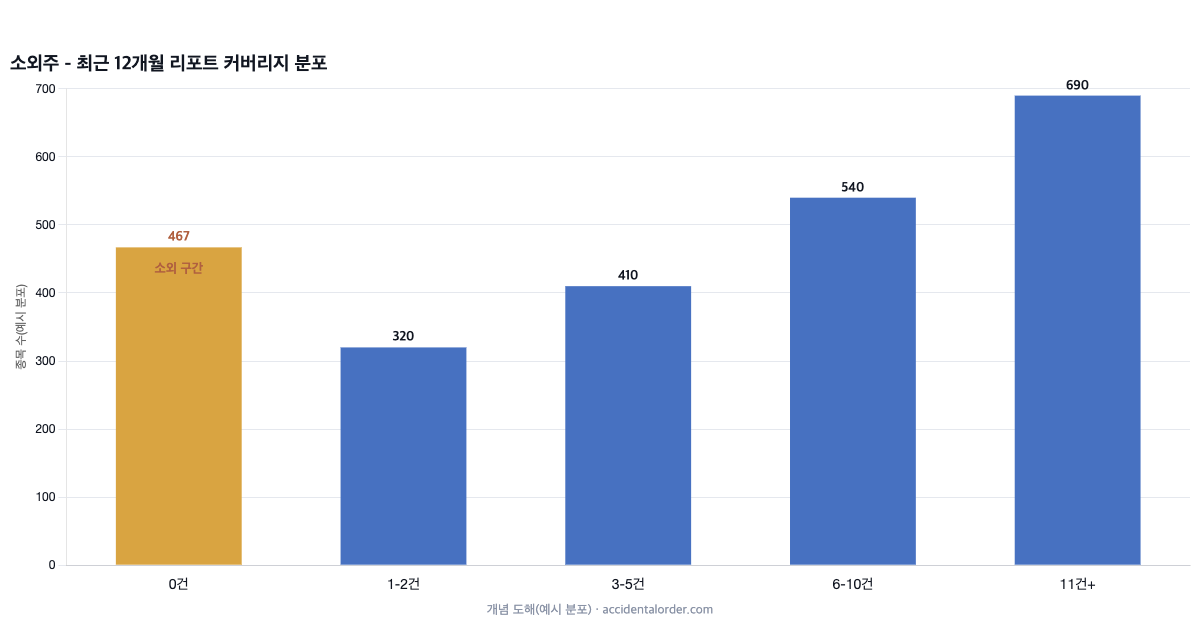
Overlooked stocks are a subject The Accidental Order will return to for a long time. Where there is no spotlight, both things coexist: the possibility that mispricing has been left behind, and the warning that there is a reason nobody is looking. This article is the starting point for handling both sides with data — how overlooked stocks come about, the logic of the opportunity, the types of trap, and a checklist to run before going near one.
1. How overlooked stocks come about
Neglect is a product of economics, not of emotion. Brokerage research is not free: reports concentrate on the stocks from which the cost can be recovered through trading commissions and corporate finance relationships — that is, on companies with large market capitalisation and heavy turnover. Institutional investors, meanwhile, are frequently barred by their own rules from holding anything that falls below their market-cap and liquidity thresholds. The result, for smaller companies, is a self-reinforcing loop: no coverage → no institutions → thin trading → deeper neglect.
| Signs of neglect | How to check |
|---|---|
| Analyst coverage of 0 to 1 | Brokerage research portals; absence of consensus estimates |
| Average daily turnover of a few hundred million won or less | Korea Exchange (KRX) statistics; your trading platform |
| Negligible institutional and foreign ownership | Ownership filings on DART (Korea’s mandatory electronic disclosure system) |
| News searches return nothing but reprinted filings | Portal news search |
2. The logic of the opportunity: inefficiency lives outside the spotlight
The real-world version of the efficient market hypothesis is: the more people analysing something, the more efficient it is. The price of Samsung Electronics reflects the analysis of thousands of people in real time; the price of a stock with zero coverage has nobody to reflect anything into it. So it genuinely happens among overlooked stocks that earnings improve structurally while the price takes several quarters to respond. The small-cap effect long reported in the academic literature — the tendency for small caps to deliver higher returns than large caps over the long run — is plausibly explained in part by exactly this informational inefficiency and by a liquidity premium.
For returns to be realised in overlooked stocks, however, a trigger for re-rating is needed: an accumulation of earnings growth, a new or increased dividend or a share buyback, the initiation of coverage, index inclusion, a dramatic turn in the industry cycle. Undervaluation without a trigger can remain undervaluation for years — which is the first trap in the next section.
3. A typology of traps
The value trap
On the numbers alone it is cheap — a PER of 4x, a PBR of 0.3x. But if it sits in a declining industry where profits are shrinking structurally, or has an ownership structure in which the controlling shareholder has no intention of sharing the profits with minority shareholders, then that cheapness can persist forever. Distinguishing whether the reason for the cheapness is a misunderstanding that can be resolved or a structure that cannot is half of the work of analysing overlooked stocks.
The liquidity trap
Sell KRW 50m worth of a stock that turns over KRW 200m a day and your own selling breaks the price. This cost, invisible on the way in, is crystallised on the way out. Position size has to be tested against the question “what percentage of this stock’s daily turnover is it?”, and the upper limit is the size the market can absorb even if you have to throw it out at market price in a hurry.
Vulnerability to manipulation
Thin trading means the price can be moved with little money, which makes such stocks attractive to market manipulators too. Unexplained surges and slumps, repeated limit-up moves driven by particular accounts, sudden inclusion in a hot theme — all of these happen more often among overlooked stocks. An overlooked stock that has caught your eye by surging is no longer an overlooked stock, and is usually at its most dangerous moment.
Information risk
No coverage also means no watchdog. Accounting problems and weak internal controls do not get filtered out by any report. Emphasis-of-matter paragraphs and key audit matters in the audit report, the history of auditor changes, and filings on pledges of shares by the controlling shareholder and changes in their stake are not optional extras for overlooked stocks but mandatory checks.
4. A checklist before going near one
| Item | Baseline (example) |
|---|---|
| Average daily turnover | At least 20x my intended position |
| Audit opinion | Unqualified for the past three years, plus a check of emphasis-of-matter items |
| Controlling shareholder’s stake | 30% or more, and free of pledges or liens |
| Direction of profits | Structural improvement over the past four to eight quarters |
| Re-rating trigger | Concrete candidates exist — dividends, buybacks, new businesses |
| Worst-case scenario | Distance from the delisting criteria (capital impairment and the like) |
And then the principle of size — an overlooked stock should never exceed a single-digit percentage of the account per name. As we saw in the article on risk, the volatility of an individual small cap hovers around and above 40%, and in this territory concentration can bankrupt you along the path however correct your analysis turns out to be.
5. Where to find the data
Every weapon in the analysis of overlooked stocks is public data: annual reports, audit reports and ownership filings on DART; turnover, short-selling and investor-type trading trends on the Korea Exchange (KRX) information data system; and research portals, which confirm the very absence of consensus estimates. The edge in this territory comes not from expensive paid information but from reading free documents that nobody else reads.
6. A screening pipeline: from 2,600 down to 20
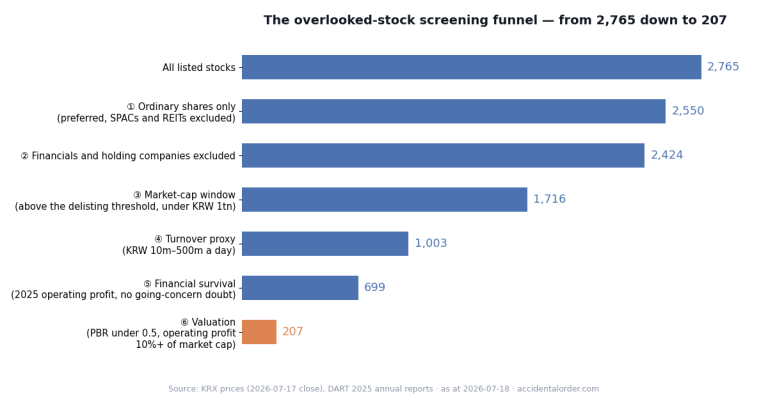
The search for overlooked stocks must be built as a funnel. Looking at every listed company one by one is impossible, and starting from the news or online communities means meeting only the companies that are no longer overlooked. A practical five-stage funnel looks like this.
| Stage | Filter | Purpose | Rough number left |
|---|---|---|---|
| 1 | Bottom of the market-cap range and coverage of 0 to 1 | Define the overlooked territory | about 1,500 |
| 2 | Exclude capital impairment, non-clean audit opinions and administrative-issue designations | Survival filter | about 1,200 |
| 3 | Three consecutive years of operating profit and positive operating cash flow | Remove the zombies | 300–400 |
| 4 | Debt-to-equity and interest-coverage thresholds | Financial stamina | 150–250 |
| 5 | A hypothesis for the cheapness can be formed, and trigger candidates exist | Fix the list for qualitative analysis | 20–40 |
Stages 1 to 4 are run mechanically with a screener (a brokerage trading platform, or any of the screening services), and human time is spent only on stage 5. The key point is that everything up to stage 4 is not a process of finding good companies but a process of erasing bad ones. In the territory of overlooked stocks, clearing the mines comes before hunting for a jackpot — and that alone changes the quality of the population dramatically.
7. Two patterns: an anatomy of re-rating and of the value trap
Successes and failures repeat in this territory with clear patterns. Not as a recommendation of any particular stock but in order to learn the structure, let us compare two typical paths in anonymised form.
| Pattern A: successful re-rating | Pattern B: the value trap | |
|---|---|---|
| Starting point | PBR 0.4x, coverage 0 | PBR 0.3x, coverage 0 (cheaper still) |
| Profits | Four to eight consecutive quarters of improvement; rising revenue share from new businesses | Profitable but flat for five years; core business shrinking |
| Where the cash goes | Dividend initiated or increased; share buybacks | Loans to companies related to the controlling shareholder; investments of unclear purpose |
| Ownership structure | Controlling shareholder holds 40%+; no succession issues | Controlling shareholder holds around 20% and has pledged the shares |
| Trigger | Accumulating earnings → first research report → institutions come in | None. “Someone will notice one day” |
| Typical ending | A stepwise re-rating over two to three years | Years of going sideways, then dilution through a cut-price rights issue |
In the end, one question separates the two patterns: is there a path by which the increased profits and the accumulated cash reach minority shareholders? The analysis is only finished when you have also checked whether the controlling shareholder has any incentive to open that path (dividends, buybacks, reinvestment in new businesses). Cheap numbers are only a starting point; it becomes an investment only when there is an agent with an incentive to resolve the cheapness.
8. The small-cap effect debate: medicine if you understand it, poison if you just believe it
The small-cap effect — “small caps beat large caps over the long run” — has been famous enough since Banz’s 1981 study to become one axis of an asset-pricing model (the Fama-French three-factor model), but decades of re-examination since have also piled up substantial counter-arguments: that the effect weakened after publication; that it is concentrated in particular periods such as January and in the very smallest stocks, and disappears once transaction costs are deducted; and the refinement that it is only meaningful when combined with a quality (profitability) filter — the effect of “small but sound” companies.
The practical conclusion is this. Buying something because it is a small cap rests on weak grounds. You buy when the individual case holds — mispricing caused by neglect, plus improving fundamentals, plus a re-rating trigger — and it is safer to treat the small-cap effect as no more than statistical background suggesting that this hunting ground held relatively more fish. Statistics can justify a tilt in a portfolio; they do not guarantee the success of any individual stock.
Frequently asked questions
Q. What percentage of an account is appropriate for overlooked stocks?
Commonly used ceilings are 10–20% for the category as a whole and 2–5% per stock. The reasoning is the same as in the article on risk: given the volatility and liquidity risk of an individual small cap, the priority is a size that will not kill you along the path even if your analysis is right. If that weight feels disappointingly small, you have not yet felt the tail risk of this territory.
Q. There is no information available. Can you really analyse a company without site visits or contact with investor relations?
You can. Reading the annual report diligently (especially the section on the business), the notes to the audit report, quarterly results and ownership filings will secure most of the material needed for the judgements in the five-stage funnel. Indeed, the edge in overlooked stocks comes precisely from the fact that nobody else reads even these public documents. A site visit is a last step for confirming a hypothesis built from the documents, not a starting point.
Q. How long do I wait? What is the exit rule?
This is territory where a time-based exit works better than a price-based one. Because the re-rating case generally has quarterly results as its verification cycle, a widely used approach is to set a hypothesis-based deadline — “if the hypothesis (improving profits, shareholder returns) has not progressed within four to six quarters, liquidate.” Sitting tight while watching only the price is not patience but the abandonment of hypothesis testing.
In closing
Overlooked stocks are territory that will hurt you if you approach it with the romantic narrative of “hidden gems”. The accurate attitude is this: mispricing really does exist outside the spotlight, but turning that mispricing into a return means passing through all four gates — trigger, liquidity, ownership structure and size management. Turn the gates into a system and it is a territory of opportunity; skip them on instinct and it is a territory of traps.
The next article covers the essential data for this territory, how to read short-selling data — the thinner the trading, the larger the traces short selling leaves behind. If the safety mechanisms of the portfolio as a whole come first for you, I recommend the articles on asset allocation and diversification. Comments via the contact details on the About page.
This article is for general information purposes only and does not recommend the purchase or sale of any particular product. Investment decisions and the responsibility for them rest with the investor.