How to Read an Income Statement: From Revenue to Profit, Line by Line
The income statement is the report card that shows “how much did this company earn over the past year (or quarter)?” Of the three financial statements it is the most intuitive, and so it is the one beginners look at first. The principle for reading it is simple. You start at the top line, revenue, and work downwards, subtracting costs of different kinds one stage at a time, following “what gets shaved off, and by how much, before profit is left.” In this article we follow those stages line by line, using the DART (Korea’s mandatory electronic disclosure system) figures of a real company, Cuckoo Homesys.
The top line — revenue
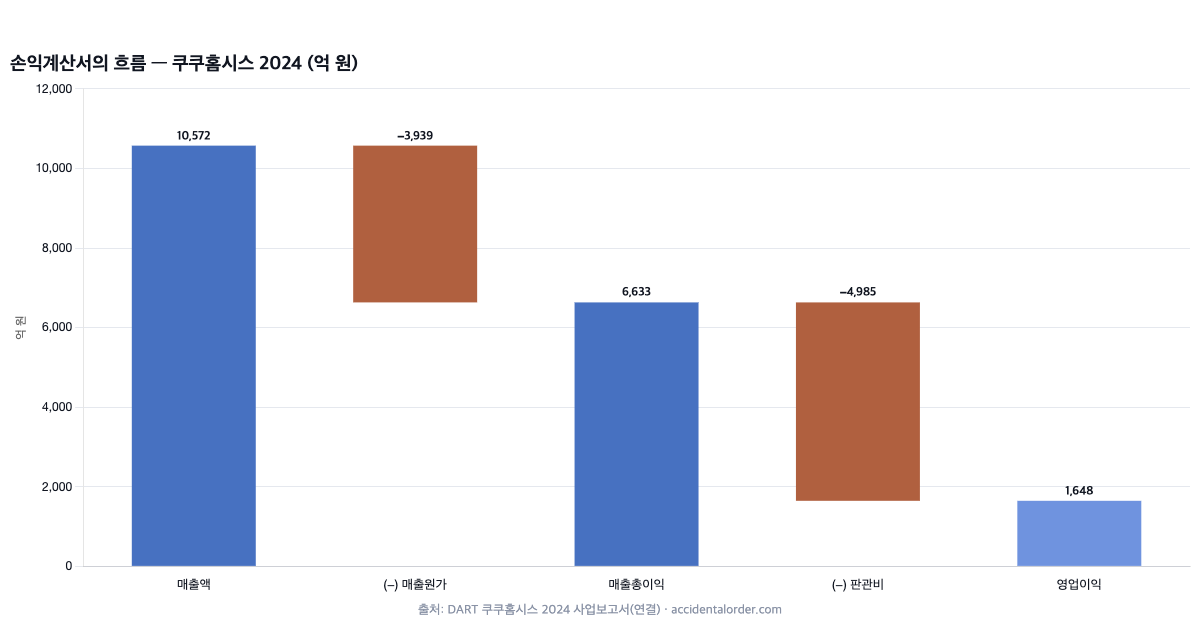
The starting point of the income statement is revenue. It is the total amount a company has earned by selling its products or services. Cuckoo Homesys posted consolidated revenue of KRW 1,057.2bn for 2024. It is a large number, but revenue by itself only tells you about “scale” — it says nothing about whether the company earned well. Profit only emerges once costs are taken out from here.
In practice, revenue is booked according to the revenue recognition standard (K-IFRS 1115). The key point is that revenue is recognised “not at the moment the money is received, but at the moment control of the goods or services is transferred to the customer.” So if goods have been handed over but payment has not yet arrived, revenue is recorded and a trade receivable is created instead. Services delivered over a period, such as rentals, are recognised across that period. When revenue jumps sharply, it pays to build the habit of checking the notes for whether “sales genuinely increased, or the recognition point was simply pulled forward.”
One more thing worth looking at alongside revenue is trade receivables turnover. If receivables swell faster than revenue as revenue grows, it can mean that cash is not being collected on time for what has been sold. If the ratio of trade receivables to revenue keeps rising year after year, that is a signal to suspect channel stuffing or delays in collection. Cross-checking the single revenue line of the income statement against trade receivables on the balance sheet and operating cash flow on the cash flow statement — that triangulation habit is what separates a beginner from a practitioner.
The first deduction — cost of sales and gross profit
The first thing subtracted from revenue is cost of sales: the money spent directly on making or buying in the product (raw materials, manufacturing labour, manufacturing overheads and so on). Take cost of sales out of revenue and you get gross profit. Cuckoo Homesys subtracted cost of sales of KRW 393.9bn from revenue of KRW 1,057.2bn, leaving gross profit of KRW 663.3bn.
Gross profit divided by revenue is the gross margin. For Cuckoo Homesys it is about 63% (663.3÷1,057.2), which means the margin on the product itself is thick. Gross margin depends heavily on the character of the industry. It is low in manufacturing and high in businesses where the value added over cost is large, such as brands, software and rentals. That is why gross margin must always be compared “within the same industry” when comparing companies.
The second deduction — selling and administrative expenses, and operating profit
The next item taken out of gross profit is selling and administrative expenses (SG&A). These are the costs of selling the product (advertising, promotion, logistics) and of running the company (head-office payroll, rent, depreciation and so on). Subtract SG&A from gross profit and you get operating profit. Cuckoo Homesys subtracted SG&A of KRW 498.5bn from gross profit of KRW 663.3bn, leaving operating profit of KRW 164.8bn.
Operating profit is the line investors treat as most important in the income statement, because it shows best how much the core business actually earns. It is the pure power of the business, not yet touched by influences from “outside the core business” such as interest, foreign exchange gains and losses, or one-off items. So whether a company’s underlying performance is improving or deteriorating is read more accurately from the trend in operating profit than from net profit.
The bottom line — non-operating items and net profit
Below operating profit come the gains and losses from outside the core business: interest expense on borrowed money, financial income from deposits and investments, foreign exchange gains and losses on foreign-currency assets and liabilities, gains and losses on asset disposals, and various one-off items. Reflect all of these and you arrive at profit before income tax; take corporate tax out of that and you get net profit.
This is where beginners most often trip up. Net profit has a great many items unrelated to the core business mixed into it, so the sentence “net profit rose” on its own tells you nothing about whether the company has improved. If, for example, shares the company holds surge and a large valuation gain is booked, net profit leaps even though the core business is unchanged. Conversely, a single one-off loss can flip net profit into the red. A vivid example of this trap is Muhak — operating profit is stable while net profit swings widely from year to year, and the cause was valuation and disposal gains and losses on the financial assets it holds. So whenever the gap between operating profit and net profit is large, you must check in the notes exactly what that gap consists of.
For reference, there is one more line at the very bottom of the income statement: total comprehensive income. It is net profit plus valuation gains and losses that have not yet been realised (differences in the valuation of certain financial assets, foreign operation translation differences and so on). In practice net profit is the figure normally used, but if total comprehensive income differs greatly from net profit, the reason is worth examining.
The power of comparison — the operating margin
The absolute amount of operating profit alone makes it hard to compare companies, because their revenue bases differ. So we look at operating profit divided by revenue: the operating margin. Even for the same KRW 10bn of operating profit, 20% earned on revenue of KRW 50bn and 2% earned on revenue of KRW 500bn describe completely different companies.
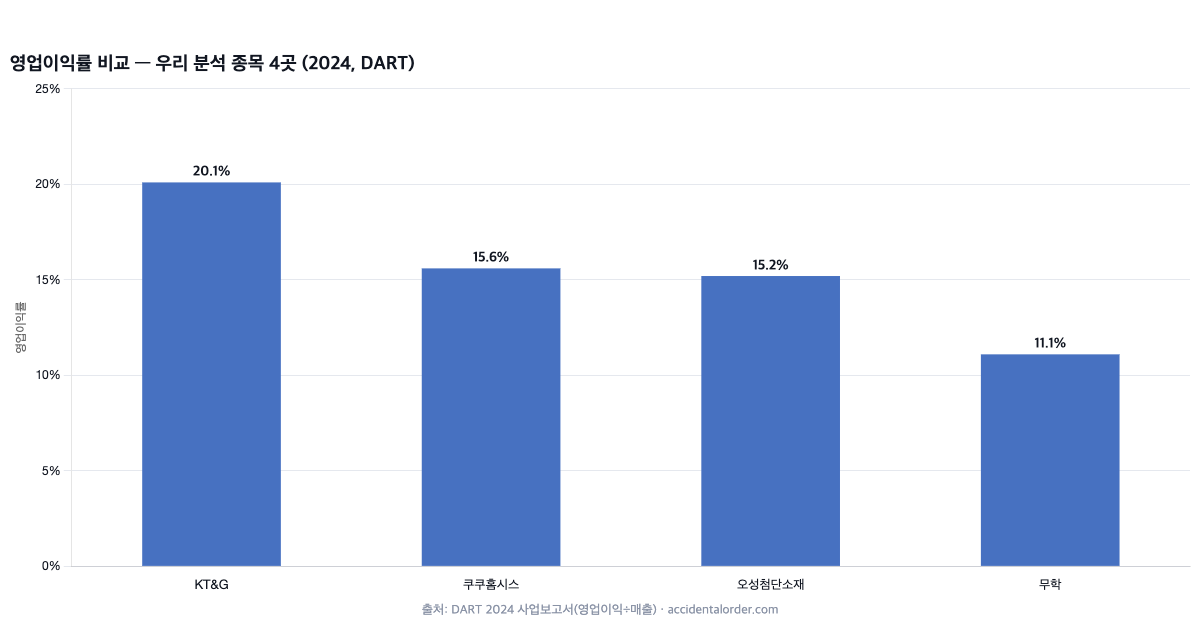
Comparing the 2024 operating margins of the stocks we have analysed, using the actual DART figures, brings out the differences in character. KT&G, at around 20%, shows the high margin characteristic of the tobacco business; Cuckoo Homesys and Osung Advanced Materials are in the 15% range, and Muhak in the 11% range. A lower operating margin at Muhak does not mean it is a “bad company” — Muhak’s investment case rests not on margin but on its thick net cash position. The operating margin is thus the first window through which to read “the character of a company’s business”, and it is most powerful when used to compare within the same industry.
Three traps when reading the income statement
First, one-off gains and losses. Items such as gains on property disposals, litigation settlements and large asset impairments distort the results of a particular quarter. So when looking at results you have to ask “how much of this profit is one-off”, and while indicators such as the “adjusted operating profit” a company publishes are worth referring to, you should check the basis for those adjustments.
Second, differences in the definition of operating profit. In the past, the items each company included in operating profit differed slightly. The standard has since been unified, but presentation can still vary by company and industry, so when comparing you should check that the basis is the same. Third, aggressive revenue recognition. If revenue suddenly spikes while trade receivables grow faster still, it may not be real sales but channel stuffing or recognition pulled forward. That is exactly why you should not look at the income statement alone, but read it alongside trade receivables on the balance sheet and operating cash flow on the cash flow statement.
The quality of revenue — recurring versus one-off
Even the same KRW 10bn of revenue differs in “quality”. One-off revenue, sold once and done, and recurring revenue that arrives month after month and year after year (subscriptions, rentals, maintenance) are not worth the same. Recurring revenue is more likely to continue into the next period and so is far more predictable, which is why the market tends to put a higher value on companies with a large share of it.
Cuckoo Homesys is a prime case. Rather than selling water purifiers and massage chairs outright, it lends them out and collects a monthly fee, so as accounts accumulate a substantial part of the following year’s revenue is already fixed. Looking only at the revenue line of the income statement, this difference is invisible; but read the business-segment descriptions and the notes in the annual report alongside it and you can gauge “how recurring this revenue is.” Looking at the quality of revenue as well as its size — that is how you read an income statement one level deeper.
Fixed and variable costs — operating leverage
By their nature, costs divide into variable costs, which rise and fall with revenue (raw materials, commissions and so on), and fixed costs, which go out at a steady rate regardless of revenue (rent, permanent payroll, depreciation and so on). This distinction matters because of operating leverage.
At a company with a large share of fixed costs, once revenue passes the break-even point a substantial part of each additional sale drops straight through to profit, because the fixed costs have already been paid. So at such companies profit grows far faster than revenue when revenue rises. Conversely, when revenue turns down, profit collapses faster than revenue. Profit volatility, in other words, is high. If the growth rate of operating profit is far larger than the growth rate of revenue in the income statement, that is a signal that this is a business with high operating leverage. Because this characteristic amplifies both good times and bad, it has to be taken into account when forecasting results.
A practical checklist — five lines of the income statement
- The revenue trend (three to five years): is it growing, holding or declining?
- Gross margin: is the margin on the product itself stable (compared within the same industry)?
- Operating margin: is the profitability of the core business holding up or improving?
- The gap between operating profit and net profit: if it is large, check the non-operating and one-off items in the notes.
- Whether items are one-off: is this profit repeatable, or a one-time event?
Depreciation inside SG&A, and a first taste of EBITDA
One item that has to be flagged when discussing SG&A is depreciation. It is the acquisition cost of long-lived assets such as plants, machinery and store fittings, recognised as an expense spread over the period of use; it is booked as a cost in the income statement, but no cash actually goes out. Companies with heavy capital investment (manufacturing, telecoms, rentals) carry large depreciation charges, and operating profit can look suppressed as a result.
So when comparing companies with heavy capital investment, people sometimes refer to EBITDA (earnings before interest, taxes, depreciation and amortisation), which adds depreciation back to operating profit. EBITDA is often used as “an approximation of cash-generating power”, but because it is an indicator that ignores depreciation, it risks overvaluing companies that face a heavy burden of reinvestment in equipment. EBITDA and its traps are covered separately in this track’s article on EV/EBITDA and DCF. Here it is enough to remember one fact: beneath operating profit lies a non-cash cost called depreciation.
Two companies of different size — the profit structures of KT&G and Cuckoo Homesys
Put two companies of completely different size side by side within the same income statement framework and the structural difference becomes sharp. KT&G’s consolidated 2024 results (DART) are revenue of KRW 5,908.8bn, cost of sales of KRW 3,006.8bn, gross profit of KRW 2,902.0bn, SG&A of KRW 1,713.2bn and operating profit of KRW 1,188.8bn. The gross margin is about 49% (2,902.0÷5,908.8).
Cuckoo Homesys has a gross margin of about 63%, higher than KT&G’s, yet its operating margin of 15.6% is lower than KT&G’s 20.1%. Why does this reversal occur? Because on the way from gross profit down to operating profit — that is, at the SG&A stage — Cuckoo Homesys spends relatively more. The rental business costs a great deal in door-to-door sales and service staff and in logistics, so even with a thick product margin, SG&A shaves a large part of it away. Seeing “at which stage profit leaks out” in this way is the essence of comparing income statements. The full analysis of both companies continues in the Cuckoo Homesys article.
Quarterly and annual — beware of seasonality
The income statement is disclosed not only annually (in the annual report) but also quarterly and half-yearly. A common mistake when looking at quarterly results is to ignore seasonality. A business whose sales cluster in summer, for instance, has an unusually strong third quarter, while one with a year-end peak season has a big fourth quarter. So quarterly results are read more accurately by comparing with the same quarter a year earlier (year on year) than with the immediately preceding quarter (quarter on quarter). It is also a good habit not to be swayed by one quarter’s spike or slump, but to read the trend from the sum of the most recent four quarters (annualised, or trailing).
How the income statement connects to the basics of investing
Reading the income statement connects to the basic fitness of investing. If a company does not pay out all the profit it makes each year as dividends but reinvests it instead, the structure of compounding — profit going on to earn further profit — operates inside the company. Conversely, however good the profits, staking your whole fortune on a single stock is dangerous, which is why asset allocation is needed alongside it. The income statement is the window through which you check how these basic principles show up in a real company. The bigger picture of reading all three statements together was covered in how to read financial statements.
To sum up, the income statement is a single story descending from “revenue → gross profit → operating profit → net profit”. Read what is shaved off at each stage and by how much, how those ratios change from year to year, and where they differ from competitors, and a list of numbers comes alive as the structure of a business. At the start, it is quite enough to begin by following just one figure — the operating margin — across three years.
Frequently asked questions (FAQ)
Q1. Should I look at operating profit or net profit?
For the strength and trend of the core business, operating profit is the accurate measure. Net profit swings widely because interest, financial gains and losses and one-off items are mixed into it. That said, the source of dividends and shareholder returns is ultimately net profit and cash, so look at both — and the key is to identify “the cause of the gap”.
Q2. Does a high gross margin always mean a good company?
The normal range differs by industry, so absolute comparison is meaningless. Software, brands and rentals run high; distribution and manufacturing run low. If it is higher and more stable than competitors within the same industry, that can be read as a signal of pricing power (brand or technology).
Q3. Why do companies go under even when they are making a profit?
Because the profit in the income statement and actual cash are different things. Even with a profit, if cash is tied up in trade receivables and inventory, or debts cannot be repaid, the company falls into a funding crisis (what Korean investors call heukja dosan, insolvency while profitable). That is why the cash flow statement must always be read alongside the income statement. To enjoy the power of time, as with compounding, the profit a company earns has to pile up as real cash.
One income statement is not enough
The income statement is powerful, but it is not self-contained. It tells you “how much was earned” and nothing more; it does not tell you “whether that profit actually came in as cash” (the cash flow statement) or “how much in assets and debt was mobilised in order to earn it” (the balance sheet). However high the operating margin, for instance, if enormous plant and debt were mobilised to produce that profit, the return on capital may be low.
So in practice we link the profit in the income statement to the equity on the balance sheet to calculate ROE (return on equity), and compare the profit in the income statement with operating cash flow in the cash flow statement to check “the quality of earnings”. Companies that looked good in the income statement often collapse at these two connections. Conversely, there are companies that look ordinary on profit alone but shine on capital efficiency and cash generation. Joining the three statements is the heart of fundamental analysis, and it is taken up in earnest in the article on ROE and ROIC. The bigger picture is set out in how to read financial statements.
The assumptions behind the numbers — the income statement is an estimate too
Finally, it is worth remembering that the profit in the income statement is not “an established fact” but “a number with estimates mixed into it”. When to recognise revenue, how much of the receivables to treat as uncollectable (bad debt), how to value inventory, over how many years to depreciate equipment — all of these assumptions change the profit figure. Which means that even for the same business, profit can differ according to accounting policy.
So when looking at profit in the income statement you should always ask “on what assumptions does this profit stand”, and the answer lies in the notes. Revenue recognition criteria, depreciation methods, the breakdown of one-off items — the assumptions that move profit are written there. The fact that we cite DART as the source for every figure and leave our mistaken judgements in the analysis ledger comes from the same attitude: numbers have to be handled humbly.
Summing up
The income statement shows the process by which profit is left over as costs are subtracted from revenue stage by stage. Gross profit shows the margin on the product, operating profit the strength of the core business, and net profit the final result once everything outside the core business is reflected as well. Investors watch the trend in operating profit and the operating margin, and the gap between operating profit and net profit. The next article covers the second statement, the balance sheet — the story of what a company owns and how much it owes at a particular point in time.
Investing study · fundamental analysis. This article is for information purposes and is not a recommendation to buy or sell any particular stock. Figures are based on the original DART disclosures and may change after the time of writing (July 2026).