Consolidated vs Separate Financial Statements: Which One Should You Read?
Open a company’s financial statements on DART (Korea’s mandatory electronic disclosure system) and the same line items appear twice over: once in the consolidated financial statements and once in the (separate) financial statements. At first sight it is easy to be thrown — “why are there two? which one am I supposed to look at?” These are photographs of the same company taken at different scopes. Consolidated bundles the subsidiaries in as one; separate covers that company alone. Without knowing the difference, revenue can suddenly look larger or smaller than it is and you misread the company. This article works through the difference between the two and the use of each, with the numbers of a real company (Cuckoo Homesys).

Consolidated statements — the group as a single company
Consolidated financial statements combine subsidiaries over which the parent has control (generally a stake above 50%) with the parent as though they were one company. If the parent holds 100% of company A and 70% of company B, consolidation adds the revenue, costs, assets and liabilities of A and B to those of the parent. Consolidated revenue therefore becomes “the total this entire group sold to outside parties”.
One core principle of consolidation is the elimination of intra-group transactions. If the parent sold goods to a subsidiary within the group, that is not revenue that left the group, so it is erased on consolidation. Without this elimination, revenue could be inflated simply by passing goods back and forth inside the group. Consolidation is thus not a simple sum but the substance of the group with “what was exchanged internally taken out, and only what was transacted with outsiders left in”.
Separate statements — the parent on its own
Separate financial statements (also called standalone statements) are the report card of that company on its own. The revenue and costs of subsidiaries are not added in; subsidiaries appear on the balance sheet merely as “the stakes held” (investment assets). Money earned by subsidiaries therefore does not show up directly in the separate income statement; it enters only as dividend income when a subsidiary pays a dividend.
There are reasons separate statements are needed. When looking at the source of dividends or at the parent’s own financial position, separate is the accurate view, because dividends are legally paid out of retained earnings on the parent (separate) basis. Taxes, too, are assessed at the level of each legal entity. So if consolidated shows “the substance of the group”, separate shows “the storehouse of that legal entity itself”. That is why both are needed.
A worked case — Cuckoo Homesys, consolidated and separate
We look at the difference between the two through the 2024 numbers of Cuckoo Homesys, a home-appliance rental company (DART). Alongside its domestic business, the company holds overseas entities in Malaysia and elsewhere as subsidiaries, so its consolidated and separate figures diverge distinctly.
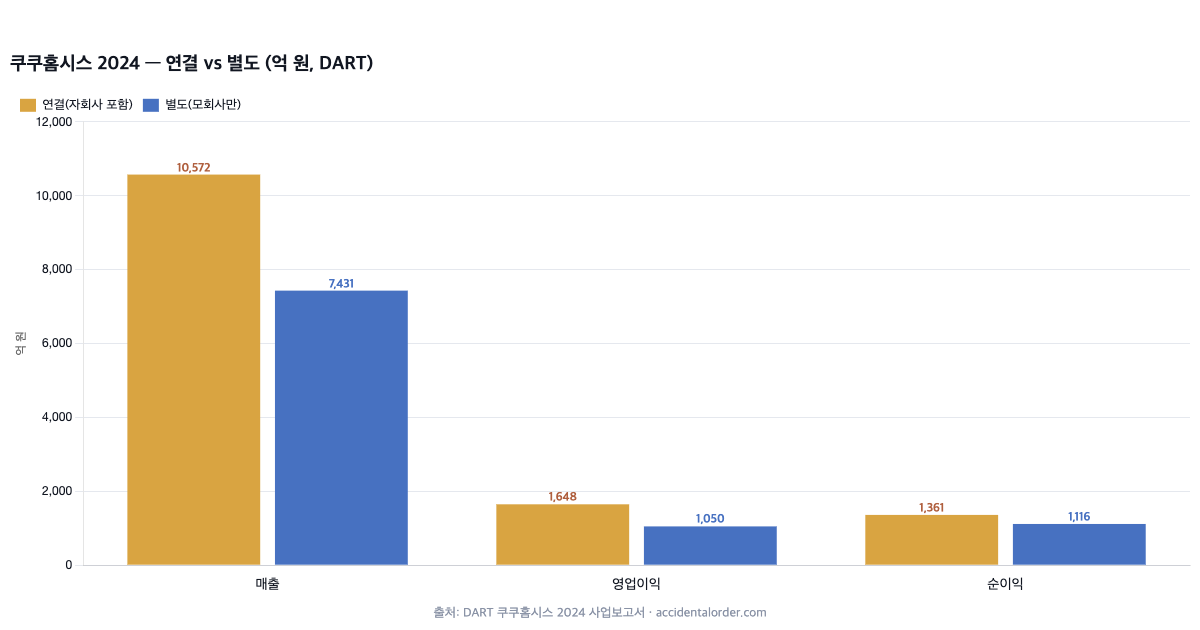
Consolidated revenue is KRW 1,057.2bn, while separate revenue is KRW 743.1bn. The difference of roughly KRW 314.1bn is revenue the subsidiaries (the Malaysian entity and others) sold to outside parties. Operating profit likewise comes to KRW 164.8bn consolidated versus KRW 105.0bn separate, with the subsidiaries adding some KRW 60bn. In other words, the fact that a substantial part of the growth of the group called Cuckoo Homesys comes from overseas subsidiaries is revealed in a single glance at the gap between consolidated and separate. Had we looked only at separate, we would have missed both the company’s true scale and the overseas contribution. The company’s business structure is covered in our Cuckoo Homesys stock analysis.
Going a step further, the Cuckoo Homesys case shows exactly “why consolidated should be the default view”. Had we looked only at separate (the parent’s KRW 743.1bn), we would have valued the company at nearly 30% less than it really is, and would have missed the core story of overseas growth altogether. Conversely, had we mistaken the whole of consolidated net profit (KRW 136.1bn) for the parent’s share, we would have overlooked the non-controlling interests (a structure in which some KRW 104.7bn remains in equity) and inflated per-share value. One company, two scopes, and within them the split by attribution — only when all three are read together does the picture become accurate.
Non-controlling interests — the trap in consolidated net profit
Consolidation carries one trap you must always check. Unless the parent owns 100% of a subsidiary (say it owns 70%), 100% of the subsidiary’s profit is added into the consolidation, but the portion that does not belong to the parent — the remaining 30% — is shown separately as non-controlling interests. In short, not all of consolidated net profit belongs to the parent’s shareholders.
At the foot of the consolidated income statement, therefore, net profit is split into the amount “attributable to owners of the parent” and the amount “attributable to non-controlling interests”. When calculating earnings per share (EPS) or PER, you must use net profit attributable to owners of the parent, not total net profit. Confusing the two overstates earnings and distorts valuation. Cuckoo Homesys is a live example: of total consolidated equity of KRW 1,046.7bn in 2024, some KRW 104.7bn was non-controlling interests, so a tenth of the capital belongs to the minority shareholders of subsidiaries. Whenever you look at consolidated numbers, you have to keep asking “how much of this is ours — the parent’s shareholders’?”
Holding companies — where consolidated and separate diverge most
The classic case in which the gap between consolidated and separate widens to an extreme is the holding company. A pure holding company runs no business of its own and merely holds stakes in subsidiaries, so on separate statements its revenue is tiny — roughly dividend income and trademark royalties. On a consolidated basis, however, the businesses of all the subsidiaries are added together and revenue can run into the trillions of won.
Looking at a holding company on separate statements alone and concluding “that’s all the revenue there is” is a complete misreading. The substance of a holding company has to be seen on a consolidated basis, and at the same time its net asset value has to be assessed separately using the market value of the subsidiary stakes. This structure is also why holding companies are so often flagged as undervalued (a low PBR) — the book value of subsidiary stakes on the separate accounts differs from their actual market value.
So which one should you look at?
It depends on the situation. For the scale of a company’s business and the trend in its results, consolidated is the default, because it shows the substance of the whole group. For dividend capacity and the parent’s own finances, separate is the accurate view, because dividends are paid out of retained earnings on the separate accounts. For a holding company, read the substance on a consolidated basis but value the subsidiary stakes separately. For a company with almost no subsidiaries, consolidated and separate are nearly identical, so either will do.
Summed up in one line, the working principle is this: “read the substance on consolidated by default, check separate for dividend and entity-level judgements, and read consolidated profit as the portion attributable to controlling shareholders.” It is because of this principle that, when we analyse a company, we mostly work on a consolidated basis while also checking separate.
The equity method — stakes without control are treated differently
Not every stake held is consolidated. The accounting treatment changes with the degree of control. Where a stake exceeds 50% and control exists, consolidation applies (full addition plus the separation of non-controlling interests); where there is only “significant influence”, generally in the 20–50% range, the equity method applies. Under the equity method, the associate’s revenue and costs are not added in; only the investor’s share of that company’s net profit is reflected in the income statement as a single line called “equity-method gains”.
A company accounted for under the equity method therefore does not appear in revenue at all and affects only one line of profit. In a company with many associates, revenue may look small while equity-method gains swing net profit substantially. A simple investment below 20% does not even get that treatment: income is recognised only when a dividend is received, or the holding is simply measured at fair value. Knowing that the treatment shifts with the ownership level — from “add in full” to “reflect in one line” to “reflect dividends only” — makes it clear why some companies do not show up in revenue even though a stake is held.
Exchange rates and overseas subsidiaries — the hidden volatility in consolidation
In a company with large overseas subsidiaries, like Cuckoo Homesys, the exchange rate intrudes as a variable in consolidation. Overseas subsidiaries prepare their financial statements in local currency, so on consolidation they are translated into won. If exchange rates move during this process, revenue and profit can appear to rise or fall for reasons unrelated to the actual business. The differences arising in translation, moreover, accumulate not in profit or loss but in an equity item called “foreign operations translation differences”, affecting total comprehensive income.
When reading the consolidated results of a company with a large overseas weighting, then, you have to separate “is this growth (or weakness) really down to the business, or to the exchange rate?” It is also why companies use phrases such as “excluding currency effects”. Consolidation shows the substance of the group, but it brings the volatility of exchange rates along with it.
Common misreadings in practice
Misreadings from confusing consolidated and separate are common. First, judging a company to be small on the basis of separate revenue. This happens especially often with holding companies. Second, mistaking all of consolidated net profit for the parent’s share and so calculating a PER that is lower — cheaper — than the real one. In companies with large non-controlling interests, this error distorts valuation. Third, mixing consolidated and separate in a comparison. Comparing company A on a consolidated basis with company B on a separate basis is comparing apples with oranges.
This site too once missed this distinction while analysing a company and mis-aggregated a debt-to-equity ratio; we corrected it as soon as it was confirmed and left a record of that history in the article. That numbers must always be checked for which scope they belong to (consolidated or separate) and which attribution (controlling or total) is a lesson we have relearned through our own mistakes.
Consolidated, separate and the three statements
The consolidated/separate distinction applies to all three statements. On a consolidated basis, the income statement also folds in the revenue and costs of subsidiaries, and the cash flow statement likewise shows the cash flows of the whole group. So the “profit vs cash” comparison learned earlier and the calculation of the debt-to-equity ratio carry meaning only when performed on numbers of the same scope — consolidated with consolidated, or separate with separate. Mixing consolidated profit with separate equity to produce a ratio yields a nonsense figure.
Equity-method gains — in the books, perhaps not in the bank
Profit recognised under the equity method carries one subtle trap. When an associate makes a profit, the investor’s share is reflected in the income statement as “equity-method gains”, but that profit has not actually landed in the investor’s bank account. Unless the associate pays a dividend, the profit remains inside that company. Equity-method gains are thus a textbook non-cash profit: they enlarge accounting net profit without bringing cash with them.
In a company where equity-method gains make up a large share, net profit can look good while cash flow from operating activities fails to keep pace. The “gap between profit and cash” covered in the earlier article on the cash flow statement shows up here too. When reading the net profit of a holding company or an investment company with many associates, you have to separate whether that profit comes with real cash or whether it is book-entry equity-method gains. The character of profit matters as much as its size.
Frequently asked questions (FAQ)
Q1. On DART, which comes first, consolidated or separate?
In section “III. Financial matters” of the report, the consolidated financial statements normally come first, followed by the (separate) financial statements. Companies with subsidiaries file consolidated statements; those without file separate statements only. The summary financial information table also distinguishes consolidated from separate, so it is worth making a habit of checking which set a number comes from.
Q2. Are PER and PBR calculated on a consolidated or a separate basis?
Generally they are calculated on a consolidated basis, but net profit is taken as the portion “attributable to owners of the parent”. Calculating PER on total net profit including the share of non-controlling interests overstates earnings. For equity (the denominator of PBR), using controlling-interest equity is likewise the more rigorous choice.
Q3. How does a loss-making subsidiary flow into the consolidation?
The loss of a controlled subsidiary is added straight into consolidated profit and loss and eats into group earnings. An associate to which only the equity method applies (generally a 20–50% stake), by contrast, is reflected in profit and loss only in proportion to the stake. That is why a group carrying many troubled subsidiaries has to be viewed on a consolidated basis for its substance to emerge.
Why beginners so often miss this distinction
The consolidated/separate distinction is not difficult as a concept, and yet beginners miss it often. There are two reasons. First, summary sites such as Naver Finance usually show only one set of numbers (mostly consolidated), so readers pass by without even knowing that two sets exist. Second, even when the original DART filing is opened, consolidated and separate appear side by side in similar formats, so one ends up looking at whichever comes to hand.
A good habit, then, is to ask yourself “is this consolidated or separate?” every time you copy a number down. Especially when comparing several companies, or cross-checking numbers from a summary site against DART, this single check prevents large misreadings. It looks trivial, but the presence or absence of this habit decides the accuracy of an analysis.
How consolidation became the default
In the past, separate (standalone) financial statements were the default. But that structure had a large loophole: if a parent pushed trouble or losses down to its subsidiaries, the parent’s separate books could still look clean. It might push goods onto subsidiaries to inflate revenue, or move debt to subsidiaries to make the parent’s finances look better — even though nothing had improved for the group as a whole.
To prevent such illusions, the adoption of International Financial Reporting Standards (IFRS) changed the primary financial statements of listed companies to consolidated ones. Once the group is bundled into one and intra-group transactions are eliminated, tricks such as hiding losses in subsidiaries or rolling revenue around no longer work. Consolidation became the default not for accounting convenience but out of a demand for transparency — “show the true substance of the group”. It follows naturally that investors give consolidated statements priority when looking at the substance of a group.
Watch for changes in the consolidation scope
There is one practical caution. When a company acquires or sells a subsidiary, the consolidation scope changes. Bringing a large subsidiary newly into the consolidation makes revenue and profit jump; removing a subsidiary from the consolidation through a disposal makes them fall abruptly. Such changes do not mean the business has actually got better or worse — only that “the scope has changed”.
So if consolidated results have swung sharply against the prior year, the first thing to check is “has the consolidation scope changed?” The details are set out in the notes to the annual report under “changes in consolidated subsidiaries”. Miss this and you may mistake revenue inflated by an acquisition for growth in the core business, or misread revenue reduced by a disposal as a weakening business. Judging the quality of growth requires an eye that separates “did it grow on the existing business alone (organic growth)?” from “did it grow through acquisition?”
Wholly owned subsidiaries and minority stakes
Where a parent holds 100% of a subsidiary, it is a wholly owned subsidiary; in that case there are no non-controlling interests and all of consolidated net profit belongs to the parent’s shareholders. Where the stake is partial, at 60% or 70%, the remainder is left as non-controlling interests. So even at the same consolidated net profit, a group with many wholly owned subsidiaries keeps that profit entirely for its shareholders, while in a group with large non-controlling interests a substantial part belongs to the minority shareholders of subsidiaries. Two companies with identical consolidated net profit can therefore deliver quite different substance to shareholders.
A checklist for reading consolidated and separate statements
- Which scope is it: is the number in front of you consolidated or separate?
- Business substance on consolidated: scale, growth and trend on a consolidated basis.
- Dividend capacity on separate: dividends come out of the parent’s separate retained earnings.
- Profit as the controlling-shareholder portion: calculate PER on the amount net of non-controlling interests.
- Take particular care with holding companies: don’t be fooled by separate revenue; use consolidated plus stake values.
Finally, it is worth remembering that judgement enters even into the setting of the consolidation scope. What counts as control (not only the ownership percentage but substantive control) and which subsidiaries to bring into the consolidation are boundaries into which accounting judgement enters. Most cases are clear-cut, but where they are ambiguous that judgement can change the picture of the group. So while it is right that consolidated statements sit closer to substance than separate ones, it is as well not to lose the humility of recognising that consolidation too is “a picture built on rules and judgement”.
Summing up
Consolidated statements bundle the subsidiaries in as one and show the substance of the group; separate statements show the storehouse of the parent on its own. Read business scale and trend on consolidated, dividend capacity on separate, and consolidated profit as the portion attributable to controlling shareholders. Where the two diverge widely, as with holding companies, take particular care over which one you are looking at. The next article links the profit and capital organised in this way to each other, covering ROE, which measures “how well a company earns on the money shareholders entrust to it”, and ROIC, which measures “how much it earns on the capital put in, debt included”. There too, the principle applies unchanged that profit and capital must be aligned to the same scope (consolidated) and the same attribution (controlling shareholders).
In short, consolidated and separate are not a question of which is superior but a question of purpose. What you want to know determines which scope to look at. Acquire this instinct and the two sets of financial statements stop being a source of confusion and become two lenses that let you see a company in three dimensions.
Investment study · fundamental analysis. This article is provided for information purposes and is not a recommendation to buy or sell any particular stock. Figures are based on the original DART disclosure filings and may change after the time of writing (July 2026).