Overlooked Stocks and Charts — How to Read the Liquidity Trap
Why the usual technical signals fail in thinly traded, overlooked stocks, and how the spread, slippage and market impact of thin liquidity distort candles, indicators and exits.

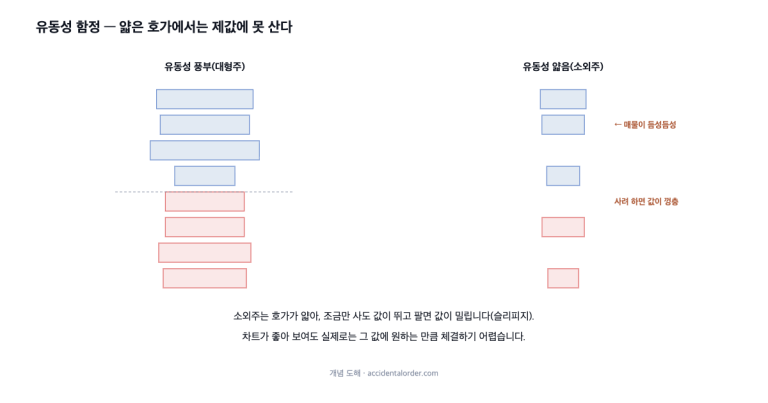
Why the usual technical signals fail in thinly traded, overlooked stocks, and how the spread, slippage and market impact of thin liquidity distort candles, indicators and exits.
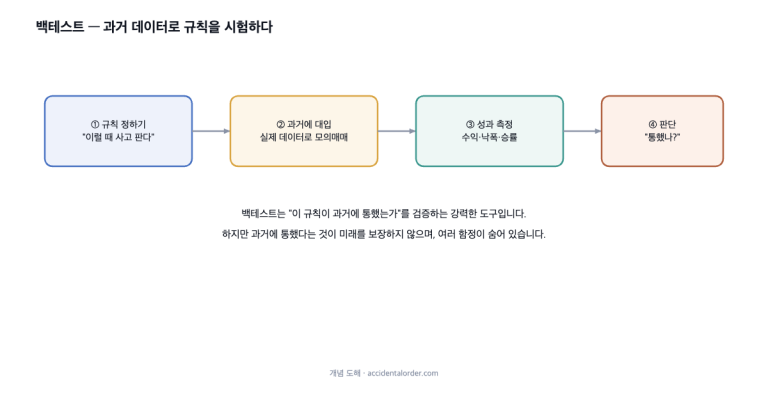
What a backtest is and why dazzling results should not be trusted at face value — overfitting, look-ahead bias, survivorship bias, trading costs and data snooping, plus how to verify honestly.
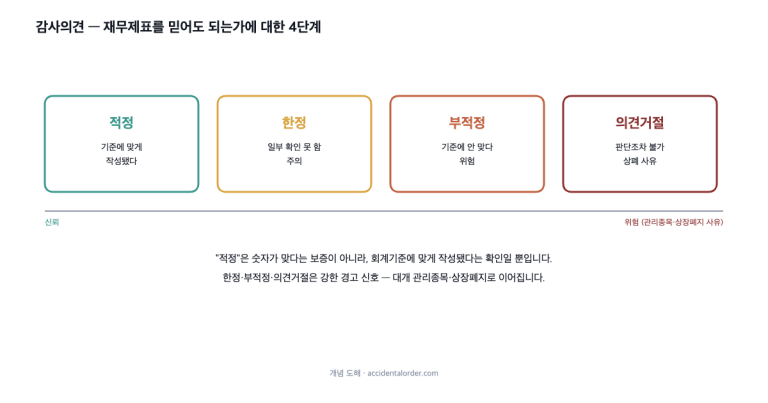
An unqualified opinion is a minimum condition, not a guarantee of quality. How to read audit opinions, and how to find going-concern and related-party risk in the notes.
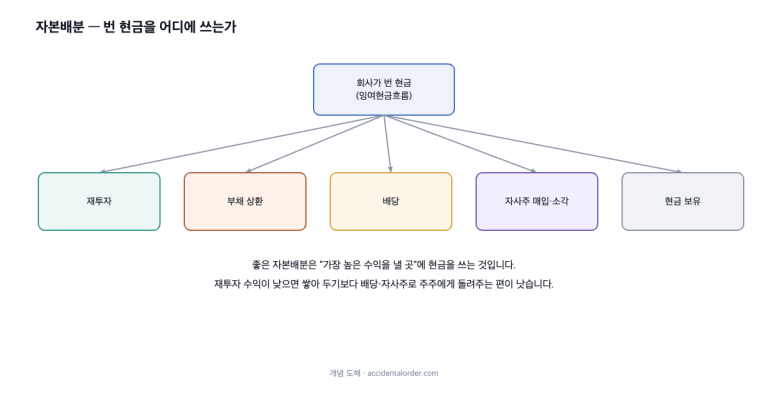
The five destinations for cash a company earns, and the tests for good and bad allocation, seen through Muhak’s dividend increase and its thick net cash.
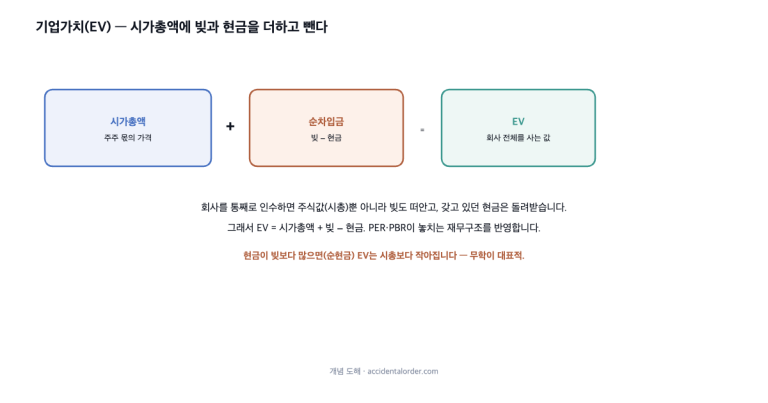
EV adds debt and subtracts cash to show the price of buying a company outright — Muhak’s is just KRW 6.6bn. How EV/EBITDA and DCF work, and the traps of depreciation and assumptions.
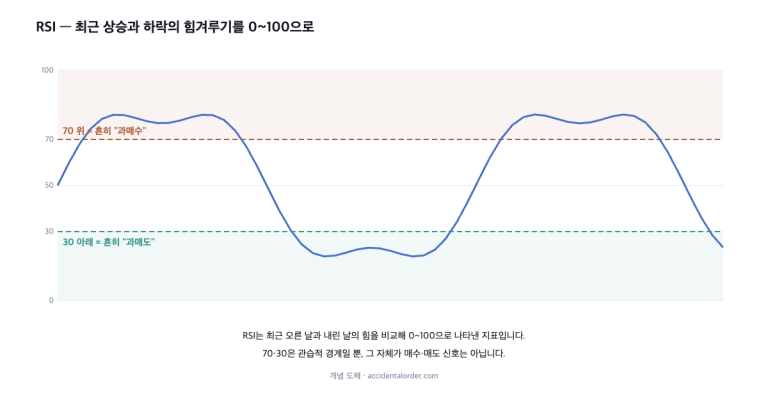
What RSI and MACD actually calculate, and why rules such as “buy at 30, sell at 70” break down — shown with Monami’s June–July 2026 price action.
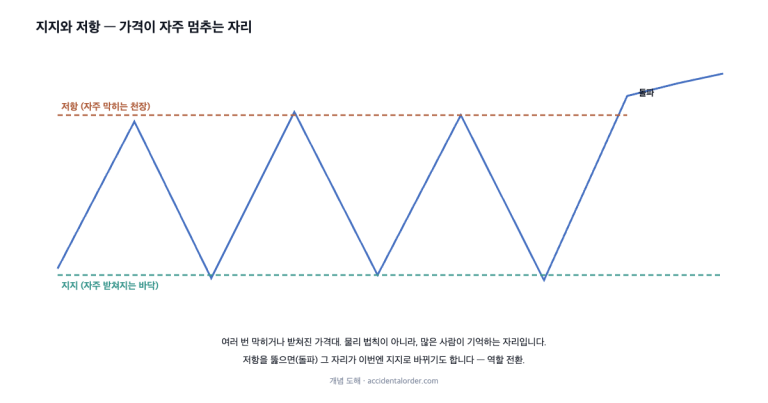
Support and resistance are psychological levels people remember, not walls that hold prices. KT&G’s 2024 trading range shows both their force and their limits.

What PER and PBR actually measure, and the traps behind them — peak earnings, value traps, and why a low multiple needs a reason and a catalyst before it means anything.
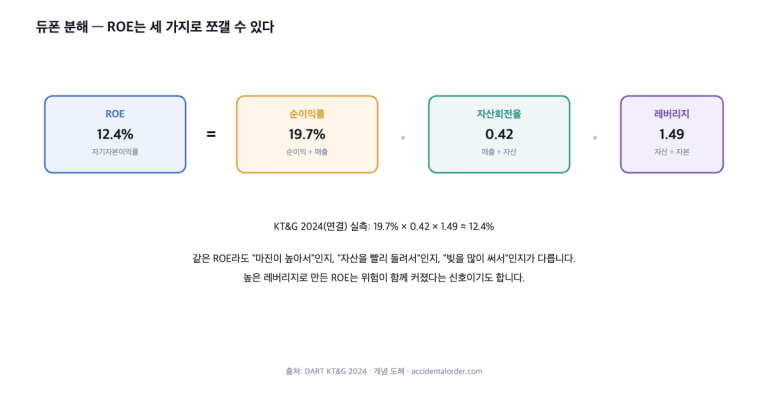
ROE splits into margin, asset turnover and leverage, and the split shows whether a high return was earned or borrowed. Plus ROIC, the stricter measure of the business against its cost of capital.

Consolidated bundles the subsidiaries in, separate covers the parent alone, and the gap can be large. Cuckoo Homesys’s 2024 numbers show why scope and attribution decide what a figure means.