Hyundai Motor and Kia, H1 2026: revenue up, but KRW 2.8tn less operating profit
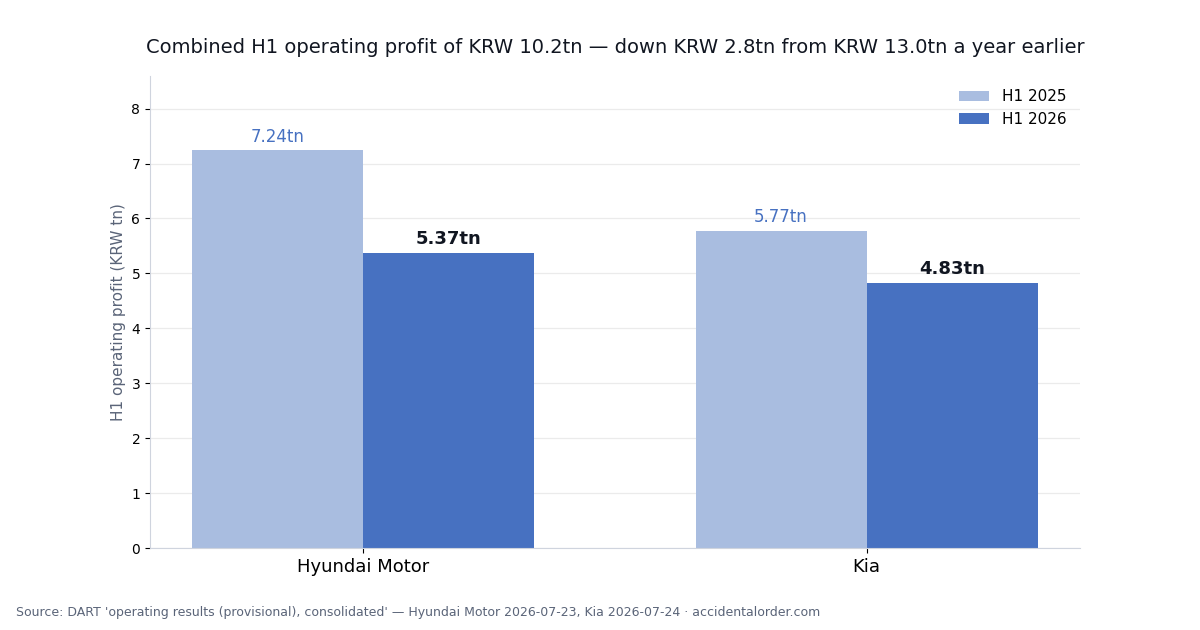
Hyundai Motor and Kia have filed their preliminary second-quarter results for 2026. Between them, first-half revenue came to KRW 157.693tn, up on a year earlier. Over the same period their combined operating profit was KRW 10.199tn — KRW 2.809tn less than the KRW 13.009tn of a year before.
“Revenue up, profit down” explains nothing on its own. This article works only with the figures the two companies disclosed, and separates what those figures confirm from what they leave open.
One thing to state at the outset: these are preliminary results. Both companies note in the filing that some values may change once their external auditors have reviewed them. The confirmed numbers arrive with the August half-year report (banyeon bogoseo, filed within 45 days of the half-year close), and the segment breakdown comes with it.
The disclosed numbers, as filed
Cumulative first-half figures on a consolidated basis. Units are KRW tn; the prior-year period is in brackets.
| H1, consolidated (KRW tn) | Hyundai Motor | Kia |
|---|---|---|
| Revenue | 95.15 (92.69) | 62.54 (57.37) |
| Revenue change | +2.7% | +9.0% |
| Operating profit | 5.37 (7.24) | 4.83 (5.77) |
| Operating profit change | −25.8% | −16.3% |
| Operating margin | 5.64% (7.81%) | 7.73% (10.06%) |
| Controlling-interest net profit | 4.86 (6.16) | 4.16 (4.66) |
| Controlling-interest net profit change | −21.1% | −10.8% |
Source: DART (Korea’s mandatory electronic disclosure system), “Operating results (provisional) on a consolidated basis (fair disclosure)” — Hyundai Motor 23 July 2026, Kia 24 July 2026. Both are prepared under K-IFRS on a consolidated basis.
Both companies moved the same way: revenue up, operating profit down, and the fall in profit far wider than the rise in revenue. Hyundai Motor’s revenue grew 2.7% while operating profit fell 25.8%; Kia’s revenue grew 9.0% while operating profit fell 16.3%.
What it means when revenue and profit move in opposite directions
If revenue rises and profit falls, then somewhere between the two, costs rose faster than revenue. The income statement starts at revenue and subtracts one class of cost after another until it reaches operating profit. Which stage absorbed how much can only be read from the line-item detail, and a preliminary results filing does not carry it. (→ How to read an income statement)
So what is confirmed at this point is the outcome alone. The operating margin fell from 7.81% to 5.64% at Hyundai Motor and from 10.06% to 7.73% at Kia — roughly 2.2 to 2.3 percentage points each. That much less is left from every 100 won of revenue.
Several causes are routinely cited: tariffs, exchange rates, sales incentives, product mix. How much any of them contributed, however, cannot be established from this filing. Rather than fill the gap with guesswork, we leave it as an item to check in the August half-year report.
Split the half into two quarters and the direction changes
The first-half figure is Q1 plus Q2. Taken apart, the two quarters tell a different story.
| Quarterly, consolidated (KRW tn) | Hyundai Q1 | Hyundai Q2 | Kia Q1 | Kia Q2 |
|---|---|---|---|---|
| Revenue | 45.94 | 49.22 | 29.50 | 33.04 |
| Operating profit | 2.51 | 2.85 | 2.21 | 2.63 |
| Operating margin | 5.47% | 5.79% | 7.47% | 7.96% |
| Operating profit vs prior quarter | — | +13.4% | — | +19.2% |
Q2 was better than Q1 at both companies. Operating profit rose 13.4% at Hyundai Motor and 19.2% at Kia, and the operating margin improved by 0.32 and 0.49 percentage points respectively.
One quarter of improvement is too little to call a recovery. Q1 may simply have been unusually low, or Q2 may have carried one-off items. What is clear is that this is a fact the half-year total hides. Read year on year, both companies look like they are deteriorating; read against the prior quarter, both look like they are climbing. Q3 will say which reading holds.
The less noticed fact — the size of what Kia earned
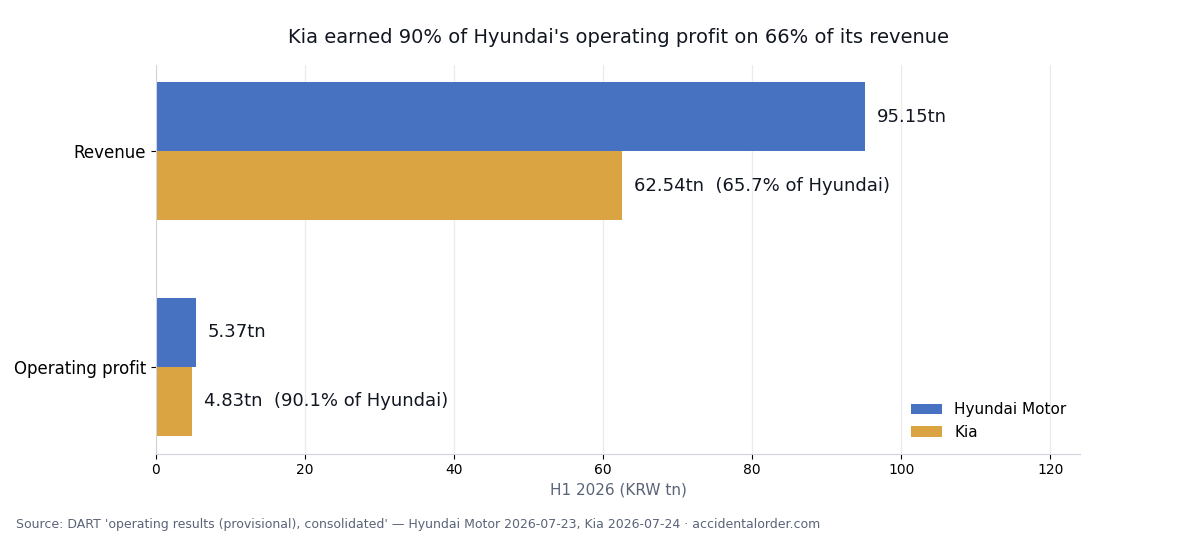
Kia’s first-half revenue of KRW 62.539tn is 65.7% of Hyundai Motor’s KRW 95.154tn. Its operating profit of KRW 4.834tn, however, is 90.1% of Hyundai Motor’s KRW 5.366tn.
Two-thirds of the revenue, nine-tenths of the profit. That is the gap in operating margin, stated in absolute terms.
Whether that gap belongs to this half-year alone requires looking further back.
The gap has been there for five straight years
Annual consolidated figures for both companies, 2021 to 2025.
| Annual (consolidated) | 2021 | 2022 | 2023 | 2024 | 2025 |
|---|---|---|---|---|---|
| Hyundai revenue (KRW tn) | 117.61 | 142.53 | 162.66 | 175.23 | 186.25 |
| Hyundai operating profit (KRW tn) | 6.68 | 9.82 | 15.13 | 14.24 | 11.47 |
| Hyundai operating margin | 5.68% | 6.89% | 9.30% | 8.13% | 6.16% |
| Kia revenue (KRW tn) | 69.86 | 86.56 | 99.81 | 107.45 | 114.14 |
| Kia operating profit (KRW tn) | 5.07 | 7.23 | 11.61 | 12.67 | 9.08 |
| Kia operating margin | 7.25% | 8.36% | 11.63% | 11.79% | 7.95% |
Source: DART consolidated financial statements (annual report for each year).
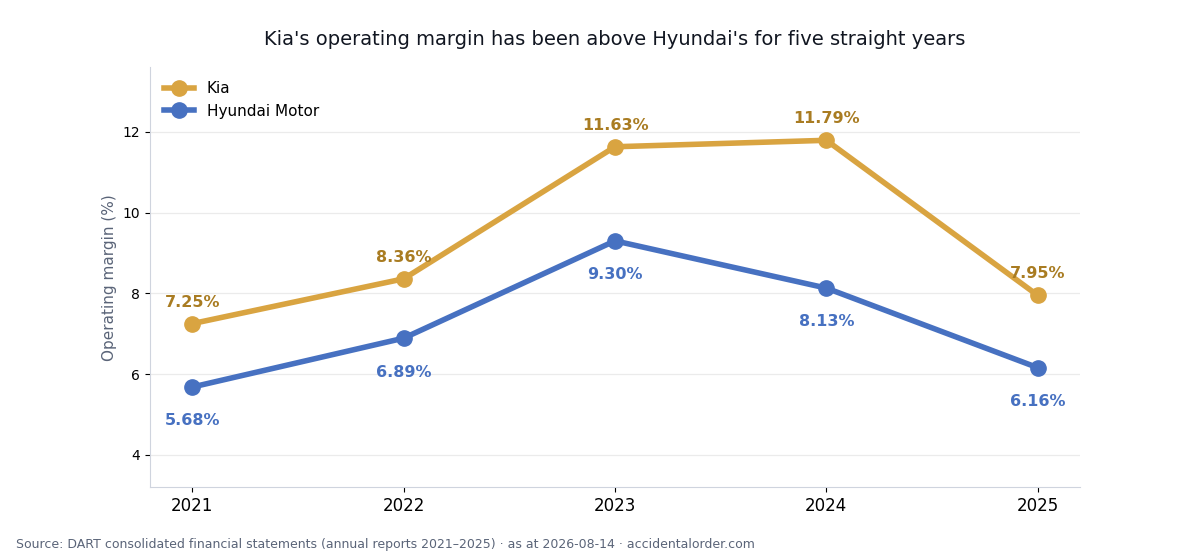
In all five years Kia’s operating margin sits above Hyundai Motor’s. The gap widened from 1.57 percentage points in 2021 to 3.66 points in 2024, narrowed to 1.79 points in 2025, and stands at 2.09 points for the first half of 2026.
The revenue lines deserve a look alongside them. Hyundai Motor’s revenue grew 58.4% over the five years, from KRW 117.61tn to KRW 186.25tn; Kia’s grew 63.4%, from KRW 69.86tn to KRW 114.14tn. Revenue rose steadily at both. Operating profit, by contrast, peaked in 2023–2024 and came down together in 2025.
One caution here. Hyundai Motor’s consolidated results contain a finance business alongside the car business. How much of the margin difference between the two companies comes from that difference in business mix can only be settled by looking at the consolidation scope and the segment breakdown. (→ Consolidated versus separate financial statements)
What happens below operating profit
A company’s year does not end at operating profit. Going further down the first-half income statement gives the two companies different shapes.
| H1, consolidated (KRW tn) | Hyundai Motor | Kia |
|---|---|---|
| Operating profit | 5.37 | 4.83 |
| Profit before income tax from continuing operations | 7.17 | 5.70 |
| Difference against operating profit | +1.80 | +0.87 |
| Net profit | 5.47 | 4.16 |
| Controlling-interest net profit | 4.86 | 4.16 |
| Non-controlling interests’ share | 0.62 | −0.001 |
At both companies pre-tax profit exceeds operating profit, which means items from outside operations added that much: KRW 1.802tn at Hyundai Motor and KRW 869.6bn at Kia. Equity-method gains, financial income and foreign-exchange items all sit in there, but which contributed how much cannot be read from a preliminary filing. It is an item for the income statement in the half-year report.
The more important difference is further down. Of Hyundai Motor’s first-half net profit of KRW 5.473tn, the shareholders’ share — controlling-interest net profit — is KRW 4.856tn. The remaining KRW 616.7bn belongs to the other shareholders of its subsidiaries, the non-controlling interests. That is 11.3% of net profit which does not reach Hyundai Motor shareholders.
Kia is the opposite. Net profit of KRW 4.158tn and controlling-interest net profit of KRW 4.159tn are all but identical: the non-controlling share is a loss of about KRW 1.1bn, so effectively everything earned belongs to Kia’s own shareholders.
The difference shows up the moment anyone computes earnings per share. Divide consolidated net profit by the share count and you have counted somebody else’s money. That is why The Accidental Order works from controlling-interest net profit rather than net profit.
Four things to watch when reading a carmaker’s numbers
Four cautions worth setting down while reading this set of results. The same items come up again next quarter.
- The consolidation is not only cars. Hyundai Motor’s consolidated results include financing businesses such as instalment lending and leasing. When the two operating margins are put side by side, part of the difference may be a difference in business mix.
- There is quarterly seasonality. Unit sales and product mix are not evenly spread across quarters. Multiplying one quarter by four to build a year is particularly dangerous in this industry.
- Preliminary and confirmed figures can differ. Both companies state in the filing that values may change following the auditors’ review. The numbers in this article need to be checked once against the August half-year report.
- Currency cuts both ways. For a company with large overseas revenue, a stronger dollar lifts won-translated revenue — but overseas costs and foreign-currency liabilities move too. Settling the direction requires the segment and currency breakdown.
Read the growth rate alone and you miss the direction
The largest-looking number in this set is Hyundai Motor’s −25.8%. On its own it says little about the state of the company, because the comparison base — first-half 2025 operating profit of KRW 7.235tn — was the second-highest of the past five years.
The same trap runs in reverse. Take a depressed half-year like this one as the base, and next year the growth rate prints positive even if the company is still doing worse than before.
So this article always states the growth rate and the absolute amount together. Hyundai Motor’s first-half operating profit fell KRW 1.870tn, from KRW 7.24tn to KRW 5.37tn; Kia’s fell KRW 939.7bn, from KRW 5.77tn to KRW 4.83tn. The percentage is background; the material for judgement is the absolute amount and the margin.
Where the market capitalisation sits
At the close on 13 August 2026, Hyundai Motor’s ordinary-share market capitalisation was KRW 85.691tn (204,757,766 ordinary shares × KRW 418,500) and Kia’s was KRW 53.643tn (390,412,998 shares × KRW 137,400). Hyundai Motor also has 60,632,342 preferred shares outside that figure.
We will not divide those numbers straight into first-half profit to produce a multiple. The moment half a year is doubled into an annual figure it stops being a disclosed number and becomes an assumption. Cars are an industry where quarterly sales mix is uneven, and there is as yet no basis for assuming the second half looks like the first. (→ The traps in PER and PBR)
Whether the price is cheap or expensive is not what this article answers. Instead we set numeric thresholds below and track, each time results are filed, whether they are cleared.
Setting the thresholds
Adding both companies to the tracking ledger with the following baselines. All are verifiable from filings, and none of them references the share price.
- Hyundai Motor — margin recovery: does the quarterly operating margin return to 6.0% or above in Q3 or Q4? (Q1 2026 5.47% → Q2 5.79%.) Falsified if it stays below 5.0% for two consecutive quarters.
- Kia — durability of the margin lead: does Kia’s quarterly operating margin stay above Hyundai Motor’s for the next four consecutive quarters? Falsified if the order reverses for two consecutive quarters.
- Both — a floor under annual profit: is the two companies’ combined 2026 operating profit KRW 16.4tn or more? (That is 80% of the KRW 20.546tn combined in 2025. With KRW 10.199tn earned in the first half, the second half needs KRW 6.201tn.)
All three are settled by the Q3 2026 results and the annual report. As each is confirmed, we update the status here and in the tracking ledger.
What to watch next
- The segment breakdown in the August half-year report — the operating margin of Hyundai Motor’s automotive and finance segments separately. This is the first material for deciding whether the margin gap between the two companies is structural.
- The Q3 operating margin — whether the Q2 improvement (Hyundai 5.79%, Kia 7.96%) continues, or gives way back to Q1 levels.
- The cost lines — which cost grew faster than revenue. Readable in the selling and administrative expenses and cost of sales detail of the half-year report.
We read large caps the same way we read overlooked ones
The Accidental Order goes looking for overlooked stocks no brokerage report reaches, and at the same time covers the most heavily followed large caps in exactly the same way — because there is one method that applies regardless of market capitalisation: analyse the financial data, set a threshold written as a number, and track where it stands each time quarterly results are filed.
Large caps are hard not because information is scarce but because there is too much of it, and it is difficult to tell what has actually been disclosed from what is still a forecast. That is why this article uses only the values written in the preliminary filings and states plainly that the cost detail and segment results, which have not been disclosed yet, are not known.
Recent large caps covered the same way: Samsung Electronics and SK Hynix, H1 2026 and LG Energy Solution, H1 2026.
In summary
In the first half of 2026, Hyundai Motor and Kia earned a combined operating profit of KRW 10.199tn, KRW 2.809tn less than a year earlier. Revenue rose at both companies over the same period. The operating margin fell from 7.81% to 5.64% at Hyundai Motor and from 10.06% to 7.73% at Kia.
Two facts inside that are easy to miss. The first is that on a quarterly view both companies improved on Q1. The second is that Kia earned 90.1% of Hyundai Motor’s operating profit on 65.7% of its revenue — and that second fact is not a feature of this half-year but a gap that has held for five straight years.
Whether that gap is structural, coming from the difference in business mix, or temporary, coming from where this cycle sits, can only be settled by the segment numbers. Those numbers are in the August half-year report, and the three thresholds set above are first tested by the Q3 results.
All figures are drawn from DART filings and KRX data. The results are each company’s preliminary Q2 2026 disclosure (Hyundai Motor 2026-07-23, Kia 2026-07-24), the annual figures are from the annual report for each year, and share prices are the closing prices of 13 August 2026. Preliminary results may change following the auditors’ review.
Update log
- 2026-08-15 — Each company covered here now has its own filing-traceable data page: price-to-book against total equity and against the owners’ share, five years of revenue, profit, equity and net cash, and the dividend, treasury and cancellation record — every figure beside the DART receipt it was read from. → Hyundai Motor (005380) · Kia (000270)