How to Read a Balance Sheet: A Company’s Inventory of Possessions and Its Seat Belts
The balance sheet is a company’s “inventory of possessions.” If the income statement shows how much was earned over the past year (a moving picture of a period), the balance sheet is a snapshot taken at one particular moment — the reporting date — of what the company owns (assets), how much it owes (liabilities) and how much belongs to shareholders (equity). That is why every number on a balance sheet carries a reference point, such as “as at 31 December 2024.” This article takes the structure apart box by box, and uses the real figures of an actual company (Muhak) to show what a balance sheet tells you.
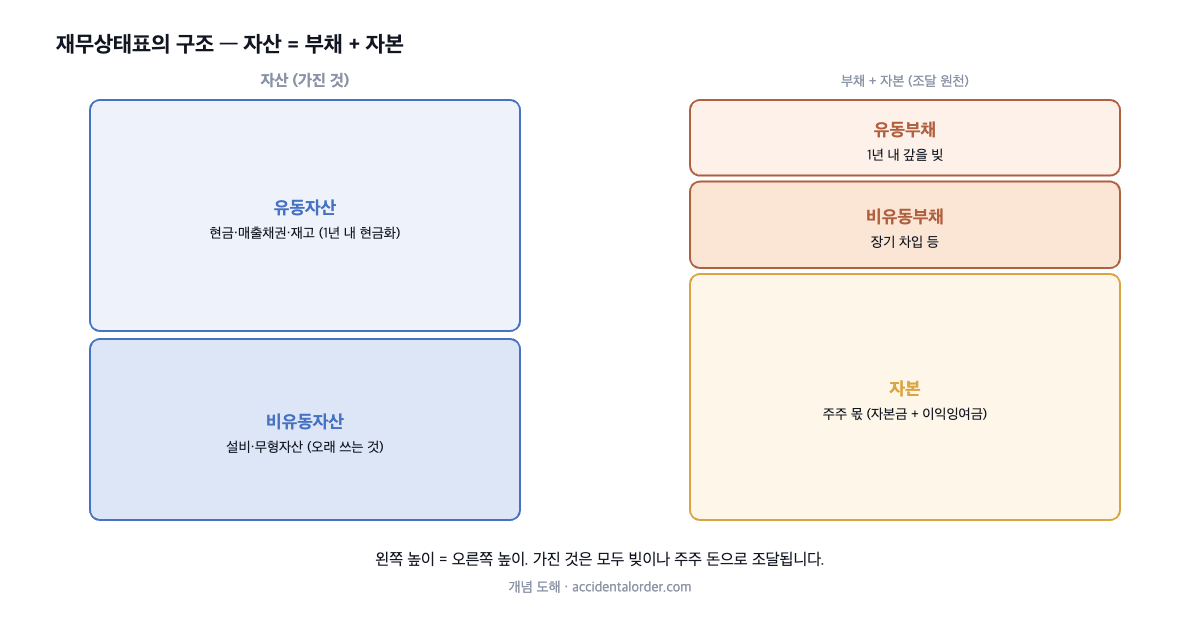
One identity — assets = liabilities + equity
The key to understanding the balance sheet is a single identity. Assets = liabilities + equity. It means that everything a company holds (assets) must have been funded either with other people’s money (liabilities) or with shareholders’ money (equity). The left-hand side (assets) and the right-hand side (liabilities plus equity) therefore always sum to exactly the same figure. That balance is where the name “balance sheet” comes from.
Turn the identity around and an important concept emerges. Equity = assets − liabilities. What the company holds, less what it must repay, is the “pure shareholders’ share” — equity, also called net assets. For an equity investor, net assets matter especially, because they show how much would be left on the books for shareholders if the company were wound up today, all its assets sold and all its debts repaid. Comparing those net assets with market capitalisation gives PBR, which we come to later.
One habit to add: a balance sheet must always be read across several dates. A single snapshot cannot tell you whether the company is getting better or worse. Whether debt is rising or falling, whether cash is accumulating or draining, whether equity is thickening or thinning — the direction only becomes visible once you line up at least three to five reporting dates. Just as the income statement is read over several years, the balance sheet is read as a time series.
Assets — current and non-current
Assets are the economic resources a company holds. They are split into current and non-current assets according to whether they can be turned into cash within a year (the normal operating cycle).
Current assets include cash and cash equivalents (money available immediately), short-term financial instruments (deposits and the like), trade receivables (money for goods sold but not yet collected) and inventories (finished products and raw materials held for sale). Thick current assets signal good short-term ability to pay, but you have to look inside them. Current assets swollen by abnormal growth in receivables or inventories can be a danger signal instead — they may represent money that will never be collected or goods that are not selling.
Non-current assets include tangible assets such as land, buildings and machinery, intangible assets such as goodwill, development costs and patents, and long-term investments. Manufacturers with heavy capital spending carry a large weight of tangible assets, while companies that have made many acquisitions carry large goodwill (the premium paid for an acquired company above its net assets). Goodwill is an asset with no physical substance, so if the acquired business underperforms it can be written off in one impairment charge, cutting net profit sharply. The weight and the character of intangible assets are items to check without fail when reading a balance sheet.
Liabilities — the maturity of other people’s money
Liabilities are the obligations a company must settle. As with assets, they are split into current liabilities repayable within a year (trade payables, short-term borrowings, the current portion of long-term debt and so on) and non-current liabilities repayable after that (long-term borrowings, bonds, long-term provisions and so on).
When looking at liabilities, character matters as much as size. Among liabilities, borrowings and bonds that carry interest are a heavy burden, whereas interest-free trade payables (raw materials bought on credit) or advances received can actually signal that the business is turning over well. In practice, therefore, attention goes to interest-bearing debt (net debt) rather than total liabilities. And if current liabilities exceed current assets (a current ratio below 100%), there is short-term repayment pressure, so the maturity profile has to be checked alongside.
Equity — the make-up of the shareholders’ share
Equity is the pure shareholders’ share, and it is divided according to where it came from. Share capital is the total par value of the shares; share premium and other paid-in capital is money that came in from issuing shares above par (the excess over par value and similar items). Both are money that shareholders put into the company. Retained earnings, by contrast, is money the company earned and kept inside rather than paying it all out as dividends.
Retained earnings matter especially. Steadily thickening retained earnings mean the company has earned a profit each year and reinvested or retained part of it, and those retained profits going on to earn further profits is compounding at work inside the company. Conversely, when a company buys its own shares (treasury shares), they are recorded as a deduction from equity and reduce it, and when shareholder returns are made (dividends, cancellation of treasury shares) retained earnings fall. The detailed movements in equity can be seen in the statement of changes in equity.
Real figures — Muhak’s (033920) balance sheet
Consider Muhak’s 2024 consolidated balance sheet (DART, Korea’s mandatory electronic disclosure system). Total assets are KRW 674.2bn, total liabilities KRW 108.8bn and total equity KRW 565.4bn (assets = liabilities + equity). Set the assets on the left beside the sources of funding on the right and what kind of company Muhak is becomes visible at a glance.
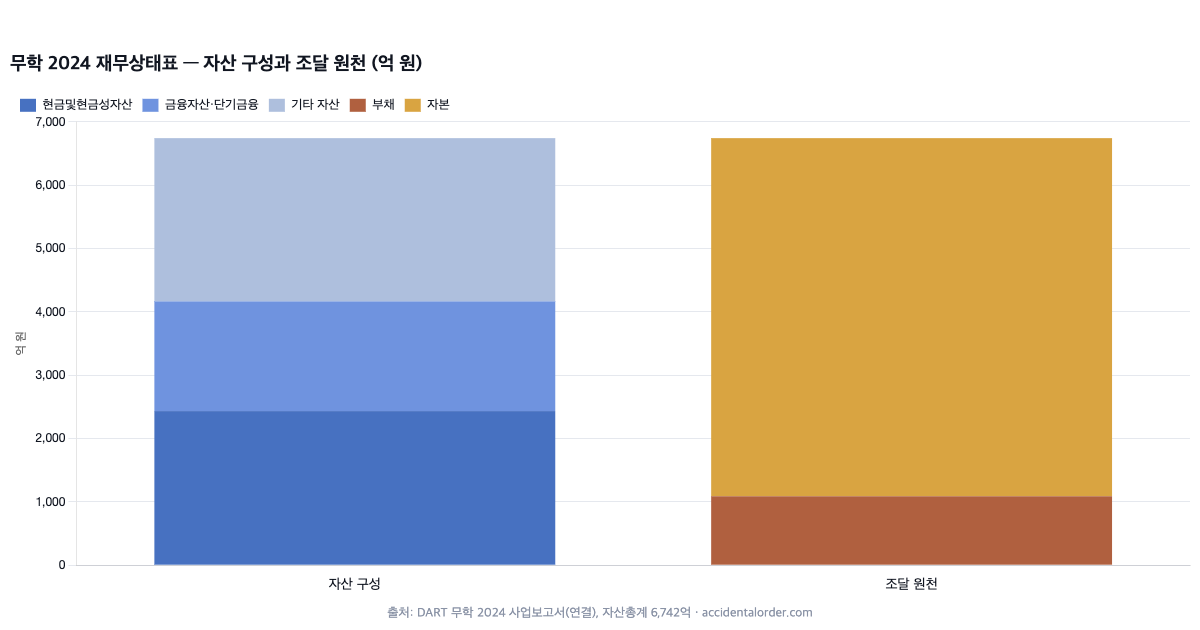
Look first at the sources of funding (right-hand side): liabilities are only KRW 108.8bn against equity of KRW 565.4bn. The debt-to-equity ratio is 108.8 ÷ 565.4 × 100 ≈ 19%, which is very low. This is a company with almost no debt — financially extremely conservative. Turning to the asset composition (left-hand side), cash and cash equivalents come to KRW 243.3bn and financial assets and short-term financial instruments to about KRW 173.2bn, so a substantial share of the assets is cash and marketable financial assets. In other words, Muhak holds a great deal of “cash and investments” rather than factory plant.
Here the central observation appears. Muhak’s market capitalisation is about KRW 214.9bn (as at 2026-07-10), while its total equity (net assets) is KRW 565.4bn. It is trading at less than half its book net assets. On top of that, a substantial part of those net assets is cash-like, so the reliability of the assets is relatively high as well. This kind of “undervaluation relative to assets” can be read straight off a single balance sheet. Whether that cash and those financial assets are returned to shareholders, or simply pile up, is another matter, and is dealt with in the Muhak stock analysis and in the article on capital allocation.
The stability measures that come out of the balance sheet
The balance sheet shows a company’s seat belts. The debt-to-equity ratio (liabilities ÷ equity × 100) shows the burden of debt, the current ratio (current assets ÷ current liabilities × 100) shows short-term ability to pay, and net debt (borrowings − cash-like assets) shows the real size of the debt. When net debt is negative — that is, cash exceeds debt — the company is in a net cash position, a powerful signal of financial stability. Muhak is a textbook net-cash company. Unlike the profit line on the income statement, these measures tell you “can this company survive a bad period?” They are hard to see in good times, but when a crisis comes these are the numbers that decide life or death.
The trap in the balance sheet — book value and market value
The thing to be most careful about on a balance sheet is that “the value written in the book may not be the real value.” Assets are in principle carried at acquisition cost less depreciation, so land bought long ago may have a market value far above its book value, while unsellable inventory may have a book value far above its real worth. Intangible assets such as goodwill are especially subjective.
And there are things the balance sheet does not capture at all. Contingent liabilities such as ongoing litigation or payment guarantees only become liabilities once a condition is met, so they do not appear in the main statements and are found only in the notes. In the other direction, a well-built brand or a company’s people are not recorded as assets. The numbers on a balance sheet are therefore only “what has been recognised under the accounting rules,” and may differ from the company’s true value. Reading the gap between book and market value alongside the contingent liabilities in the notes is how you read a balance sheet deeply.
Working capital — the money tied up in the business
Combine the current items on the balance sheet and you get working capital. Roughly “trade receivables + inventories − trade payables,” it is the money routinely tied up in running the business. It is the funding the company must genuinely provide in the course of making goods (inventories), selling them on credit (receivables) and buying raw materials on credit (payables).
Working capital matters especially when looking at a growing company. When revenue climbs quickly, receivables and inventories swell with it, and a situation arises in which profits are made while cash actually dries up. Conversely, a company with strong bargaining power stretches its payables and shortens its receivables, using almost no working capital or even running it negative. Rather than judging current assets and current liabilities by size alone, watching how working capital moves alongside revenue growth reveals a company’s cash-generating power. This link carries on into the next article, on the cash flow statement.
Reading a company’s type from its balance sheet
The composition of a balance sheet alone reveals a company’s character. First, the asset-play type: thick with cash, financial assets and property and light on debt, so that market capitalisation is low relative to net assets. Muhak is close to this — the core business does not earn a great deal, but assets are piled high on the books. For such a company, the investment question is “will those assets be returned to shareholders?”
Second, the growth type: profits rise quickly relative to assets, so the shares trade far above net assets (a high PBR). Here the price is set by future profits rather than by the assets on the balance sheet. Third, the leverage-using type: businesses such as rentals, infrastructure and telecoms that use stable cash flows as security to employ debt actively and run an operation large relative to their equity, where a high debt-to-equity ratio can be perfectly normal. Establishing “which type is this company?” first makes the meaning of every measure you look at afterwards much clearer.
Holding companies and financials — where the balance sheet is a special case
There are two cases in which the interpretation of a balance sheet differs greatly from an ordinary operating company. For a holding company, a substantial share of assets consists of stakes in subsidiaries (investments in associates and subsidiaries), so the assets in the separate financial statements are mostly “the book value of subsidiary shares.” That book value can differ greatly from the subsidiaries’ actual market value, so when looking at a holding company’s net assets you must look at the consolidated financial statements and the market value of the subsidiaries together.
Financial companies (banks, brokerages, insurers) are another world altogether. For them, deposits and insurance liabilities are the raw material of the business, so debt-to-equity ratios in the hundreds or thousands of per cent are normal, and most of their assets are loans and securities. Applying the yardstick of ordinary manufacturing (a debt-to-equity ratio of 100–200%) straight to them leads you badly astray. Financial companies are assessed with dedicated measures such as the BIS capital ratio and the RBC solvency ratio. This is why, when reading a balance sheet, you must always establish first “what industry is this company in?”
How the balance sheet connects to investing fundamentals
The balance sheet connects directly to the basic fitness of an investment. The debt-to-equity ratio is the size of the risk a company carries, which is the corporate version of the volatility and maximum drawdown covered in investment risk. Companies with a lot of debt are shaken harder in bad periods. And however good a company’s finances, staking your whole fortune on a single stock is dangerous, which is why asset allocation is needed alongside. However well you read an individual company’s balance sheet, without diversification at the portfolio level an accident at one company can bring the whole thing down.
The traces of shareholder returns left in equity
The equity section of the balance sheet carries the traces of how a company has treated its shareholders. When a company buys its own shares (a buyback), they are recorded as treasury shares, a deduction from equity, and reduce it. And when those treasury shares are cancelled, the number of shares in circulation falls permanently, enlarging the share belonging to the remaining shareholders. When dividends are paid, retained earnings fall by that amount.
So reading several years of balance sheets in sequence shows how a company has handled the money it earned. If retained earnings simply keep swelling with no trace of buybacks or dividends, the company is only piling money up. If, on the other hand, retained earnings grow while buybacks, cancellations and dividends continue steadily, shareholder returns are genuinely being made. At an asset-rich company like Muhak, this question — “does the accumulated pile flow out to shareholders?” — is precisely the heart of the investment judgement. The subject is taken up properly in the article on capital allocation, which brings dividends, buybacks and net cash together.
Question the quality of the assets
Before taking pleasure in a large total-assets figure on a balance sheet, you must ask whether those assets are “genuinely valuable assets.” Even at the same KRW 10bn, a bank deposit of KRW 10bn, unsellable inventory of KRW 10bn and a KRW 10bn loan stuck in a failing subsidiary are entirely different things. Experienced investors therefore look at the composition inside the total rather than at the total itself. Plentiful cash-like assets mean high asset quality; bloated receivables, inventories, goodwill and other loans put that quality in doubt.
Three things call for particular vigilance. First, trade receivables growing faster than revenue — uncollectable money may be piling up. Second, inventories that keep swelling without selling — the risk of obsolescence losses. Third, goodwill stacked high by acquisitions — if the acquired business underperforms, it is written off in one large impairment charge. If these three items are trending towards bloat, a large total-assets figure is a danger signal rather than a comfort. Assets are judged by quality, not by size.
The order in which to read a balance sheet — a five-minute checklist
- The trend in equity and retained earnings (3–5 years): are they thickening steadily, and is there any risk of capital erosion?
- Debt-to-equity ratio and net debt: is the debt burden light, and is the company in net cash?
- Current ratio: is there the ability to meet short-term repayments (current assets vs current liabilities)?
- Asset quality: what is the weight of cash-like assets? Are receivables, inventories and goodwill bloated?
- Net assets vs market capitalisation: what is the PBR saying, and what does it say once asset quality is taken into account?
Frequently asked questions (FAQ)
Q1. What debt-to-equity ratio counts as safe?
It varies greatly by industry. Manufacturing is usually judged against a benchmark of 100–200%, but industries that use debt heavily by the nature of their business model, such as rentals and finance, can be normal at higher levels. Rather than the absolute figure, compare with peers in the same industry and look at the share of interest-bearing debt and its trend.
Q2. What happens if equity goes negative?
That is a state in which liabilities exceed assets (capital erosion), with accumulated losses having eaten through equity. Even partial capital erosion can be grounds for designation as an administrative issue (gwalli jongmok, the KRX watchlist status for companies at risk), and complete capital erosion is grounds for delisting. This is why the trend in equity and retained earnings on the balance sheet is worth watching.
Q3. Does a PBR below 1x automatically mean cheap?
PBR is market capitalisation ÷ equity (net assets), and below 1x means the shares trade below book net assets. But the meaning changes completely with the quality of the assets (is it cash, or unsellable inventory and impaired goodwill?). The traps of PBR are dealt with separately in this track’s article on PER and PBR.
The assumptions behind the numbers — the balance sheet is an estimate too
The numbers on a balance sheet are not settled facts either; estimates are mixed in. What value to place on inventories, how much to provide for receivables that will not be collected (the allowance for doubtful accounts), over how many years to depreciate tangible assets, whether goodwill has been impaired — management’s judgement enters all of them. Goodwill and intangible assets in particular, along with financial assets measured at fair value, take on very different values depending on the assumptions.
So when reading a balance sheet too, the basis of the numbers has to be checked in the notes. Valuation methods for assets, contingent liabilities, related-party transactions, assets pledged as collateral — things that are invisible in the main statements or summarised in a single line are set out in detail in the notes. The fact that we cite a DART source alongside every figure and record mistaken judgements in the analysis record comes from the same attitude — the books should be read with humility.
In summary
The balance sheet is a snapshot at the reporting date, standing on the single identity “assets = liabilities + equity.” Assets are divided into current and non-current, liabilities by maturity and by whether they bear interest, and equity into money shareholders put in and money the company earned and kept. Out of this come stability measures such as the debt-to-equity ratio, the current ratio and net cash, and comparing net assets with market capitalisation gives a sense of whether the shares are undervalued. But the gap between book and market value, and the contingent liabilities in the notes, have to be read alongside. The next article deals with the third statement, the cash flow statement — the story of whether book profits arrive as real cash, and of how to catch the scent of window dressing.
Investing study · fundamental analysis. This article is for information only and is not a recommendation to buy or sell any particular stock. Figures follow the original DART filings and may change after the time of writing (July 2026).