The Owner’s Share: P/B for 183 Korean Companies, Recalculated from the Filings
A screener divides a company’s market capitalisation by its total equity and calls the result price-to-book. For a company that owns large subsidiaries it does not wholly own, that division compares the price of one company against assets that partly belong to somebody else. We rebuilt the calculation for 183 Korean listed companies from their DART filings, measuring each one twice — once against total equity, once against the equity attributable to the parent’s own shareholders — and published every row with the receipt number of the filing it came from.
Three things fall out of the comparison, and all three are arithmetic rather than opinion.
- 69 companies read below 1.0× on total equity. On the owners’ share, 65 do. The population of “below book” names shrinks by four once non-controlling interests are removed.
- Four companies cross the 1.0× line entirely. SK (034730) reads 0.50× and 1.70×. HD Hyundai (267250) reads 0.61× and 1.84×. Misto Holdings (081660) reads 0.87× and 1.17×. Hyosung (004800) reads 0.99× and 1.16×. Same day, same filings, two different sides of the same threshold.
- The gap is concentrated, not general. Across the 26 holding companies in the dataset the median gap is +28.90%. Across the other 157 companies it is +1.49%. For most of the market the two readings are nearly the same number.
- The average is not the typical case. The median gap across all 183 companies is +2.40%; the mean is +21.64%. A handful of very wide gaps pull the average nine times above the middle of the distribution.
- Twenty companies sit above +50%. Ten of those are above +100%.
None of this says a share is cheap or dear. It says that two defensible ways of computing the same ratio produce different numbers for the same company on the same day, and that which number you see depends on which denominator your data source used.
What the two numbers actually measure
Consolidated financial statements add up a parent company and everything it controls. If a parent owns 60% of a subsidiary, the subsidiary’s assets and liabilities appear in full on the consolidated balance sheet, and the 40% belonging to the subsidiary’s other shareholders is carried in a separate line inside equity: non-controlling interests.
Market capitalisation, meanwhile, is the price of the parent’s own shares. It never included the 40%. So the two sides of the price-to-book fraction are not describing the same claim:
- P/B on total equity — market capitalisation ÷ total equity, including non-controlling interests. This is what most screeners report.
- P/B on the owners’ share — market capitalisation ÷ equity attributable to owners of the parent. Numerator and denominator now describe the same set of shareholders.
- Gap — how much higher the second reading is than the first, in per cent. It rises with the size of the non-controlling interests, and it is zero when there are none.
Neither reading is a mistake. They answer different questions, and the second one is the one that matches what a buyer of the listed shares is actually buying. The dataset applies the same split to earnings: price-to-earnings is computed against controlling-interest net profit rather than consolidated net profit, for the same reason.
Why the gap is large in Korea specifically
The mechanism is not Korean, but its incidence is. A large share of the Korean listed market is organised as holding-company groups, and that structure produces exactly the conditions under which the two readings diverge.
A group holding company typically owns controlling but partial stakes in several operating subsidiaries — often 30% to 50% — and several of those subsidiaries are themselves separately listed. Consolidation requires the parent to bring 100% of each controlled subsidiary’s balance sheet onto its own, then park the rest of the ownership in non-controlling interests. The larger and more numerous the partly-owned subsidiaries, the larger that line grows relative to the equity that belongs to the holding company’s own shareholders.
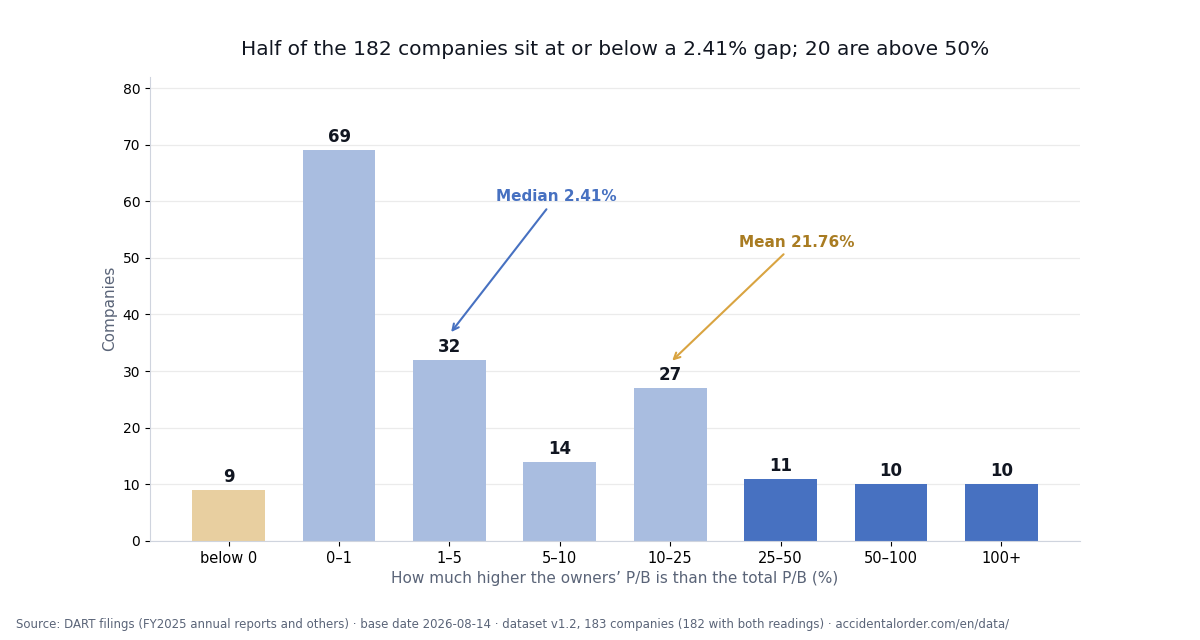
The distribution below shows how uneven the result is. Seventy of the 183 companies sit in a band between zero and one per cent — for them the question barely arises, because they have almost no non-controlling interests to remove. The tail is where the structure lives.
Three companies, read twice
SK (034730): 0.50× and 1.70×
SK is the holding company of the SK group, with a market capitalisation of KRW 42.7tn at the base date. Measured against total equity it reads 0.50×. Measured against the equity attributable to its own shareholders it reads 1.70× — a gap of +240.2%. The figures come from the FY2025 annual report, DART receipt 20260318001157.
The arithmetic is the whole story. SK consolidates SK Hynix, SK Innovation, SK Telecom and others in which it holds controlling but far-from-total stakes. Their combined balance sheets land on SK’s consolidated statement in full; the portion belonging to those subsidiaries’ other shareholders sits in non-controlling interests. Remove it and the denominator falls by roughly the factor you would expect from a 240% gap. A screener showing 0.50× is not reporting a wrong number — it is reporting a number about a different denominator.
Doosan (000150): 2.20× and 17.25×
Doosan carries the widest gap in the dataset at +684.7%: 2.20× on total equity, 17.25× on the owners’ share, from DART receipt 20260323000945. Market capitalisation is KRW 26.9tn.
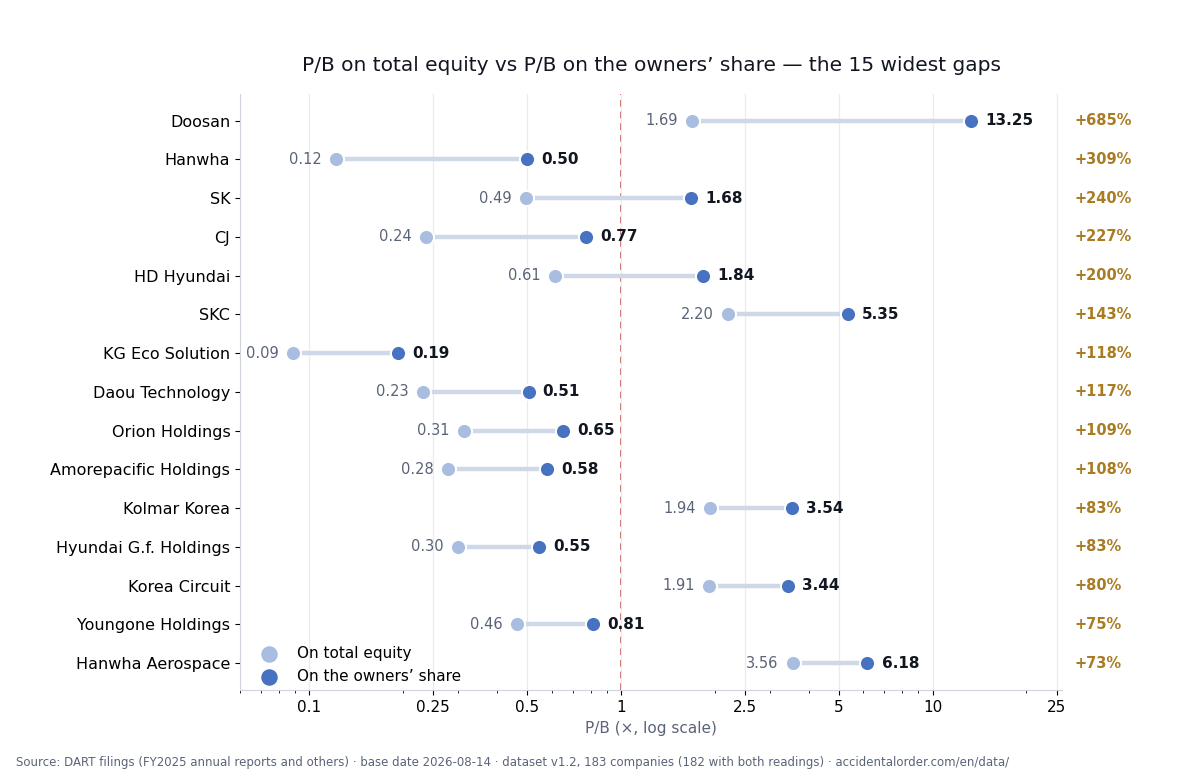
What produces a figure that large is a denominator that is small in relation to the consolidated total — the controlling-interest share of Doosan’s consolidated equity is a minority of it, because the group’s principal operating companies are consolidated subsidiaries with substantial outside ownership. When the denominator shrinks by roughly seven-eighths, the ratio multiplies by roughly eight. This is also why Doosan sits on a log scale in the chart above: on a linear axis it would flatten the other fourteen companies into a single stripe.
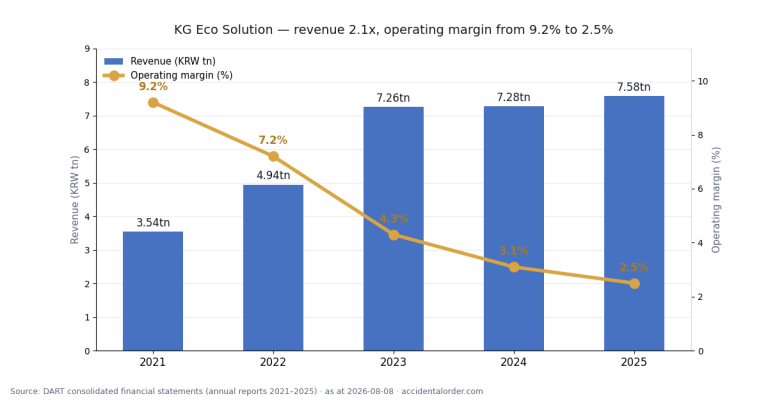
KG Eco Solution (151860): 0.09× and 0.19×
KG Eco Solution reads 0.09× on total equity and 0.19× on the owners’ share, a gap of +117.7%, from DART receipt 20260318001667. Market capitalisation is KRW 277bn.
This one matters because 0.09× is the kind of number that gets screenshotted. It is a small company rather than a chaebol holding vehicle, which shows that the effect is not confined to the large groups — a small parent with one big partly-owned subsidiary produces the same arithmetic. We wrote about this company in detail before building the dataset: KG Eco Solution (151860): the 0.09× P/B is an illusion. The 183-company table is that single calculation, extended.
How the numbers were built
The universe is the top 200 KOSPI common shares by market capitalisation plus ten smaller companies already under coverage here, with financial companies removed — 183 companies after exclusions, covering 97.1% of KOSPI common-share market capitalisation at the base date. It is not an official exchange index and does not track one.
Banks, insurers, securities firms and financial holding companies are out because the schema does not describe them: total borrowings cannot be separated from operating liabilities on a bank’s balance sheet, so the net-cash column would be meaningless. Every figure carries the DART receipt number of its filing. Where a filing does not carry a number, the cell is left empty rather than filled with an estimate.
Two exceptions are allowed, and both are arithmetic identities inside the same statement rather than estimates. Some companies never print a controlling-interest line because they have no non-controlling interests to separate; for those, controlling-interest equity is total equity less non-controlling interests, or — where no such line exists at all — net profit in full. Nine companies in the dataset are affected and every one of them is flagged, so a reader who wants to exclude them can. If a non-controlling-interest line is printed but could not be read, neither rule fires and the cell stays empty.
The full rules — universe, financial exclusion, the identity rules, how total borrowings are summed, preliminary versus filed figures, consolidated versus separate statements, sector labelling and the update policy — are set out on the methodology page.
Sort it yourself
The point of publishing the table rather than a list of highlights is that the interesting row is usually not the one someone else picked. The adjusted valuation table carries all 183 companies with both P/B readings, the gap, P/E on the owners’ share, net cash over market capitalisation, treasury holdings, cancellation history and the latest dividend per share. Every column sorts. Every column filters. Every cell links to the filing it came from — the receipt numbers in the last two columns open the original document in the DART viewer, so any number here can be checked against its source in one click.
Reading the table needs no email. The full CSV, with all 25 columns including both receipt numbers, is available from the same page. The data room is where subsequent datasets will appear, and the base date on each one says which day its market figures belong to.
What this is not
A wide gap between the two readings says a company has large non-controlling interests. It does not say the shares are cheap or dear, and this article makes no such claim about any company named in it. A narrow gap says the opposite about the balance sheet structure and equally nothing about price. The figures are as at the base date of 2026-08-14 and change afterwards.
This page is information, not a recommendation to buy or sell any security. It carries no price target and no trade timing. See the disclaimer for the full terms.
Update log
- 2026-08-15 — dataset correction (v1.1 → v1.2) — market capitalisation, P/B and P/E now divide by the share count listed on the base date rather than the count printed in the FY2025 annual report, which is stated as at the financial year-end and so missed splits, consolidations, bonus and paid-in issues, cancellations and mergers that came afterwards. 64 of the 183 companies changed. Of the figures in this article, Doosan reads 13.25× on the owners’ share, not 17.25×, and SK reads 1.68×, not 1.70×. The count below 1.0× moves from 70 to 66, not 69 to 65; the median gap is +2.41%, not +2.40%, and the mean +21.76%, not +21.64%. The gaps themselves did not move at all — the share count cancels out of the ratio between the two readings. Doosan +684.66%, SK +240.22%, KG Eco Solution +117.73%, the holding-company median +28.90%, the 20 companies above a 50% gap and the 10 above 100%, and the four that cross 1.0× are all unchanged. Both charts have been redrawn on the corrected figures. Two figures were withheld rather than corrected: the share-count table in LS Eco Energy’s annual report carries a million-fold unit error, and Doosan Bobcat files its statements in US dollars, so the ratios that would pair them with a won market capitalisation are left blank. → Dataset changelog · Adjusted valuation table
- 2026-08-15 — Each company covered here now has its own filing-traceable data page: price-to-book against total equity and against the owners’ share, five years of revenue, profit, equity and net cash, and the dividend, treasury and cancellation record — every figure beside the DART receipt it was read from. → SK (034730) · Doosan (000150) · KG Eco Solution (151860) · Hanwha (000880) · HD Hyundai (267250) · Hyosung (004800) · Misto Holdings (081660) · Samsung Electronics (005930) · SK Hynix (000660)
Get the next quarterly update for this company by email
When the next results are filed we send where this scenario stands. Nothing else.