Support and Resistance: Where Prices Stop, and the Illusion That Follows
Stare at a chart long enough and prices can look as though they keep halting or turning back at particular levels. Rising, they are repeatedly blocked at some value (resistance); falling, they are repeatedly propped up at another (support). These “levels where prices often stop” are support and resistance. Many investors attach great significance to them, but the aim of this article is to understand precisely what they are. Support and resistance are not magic walls that set prices in advance; they are psychological levels that a lot of people remember. We will look at both their power and their limits.
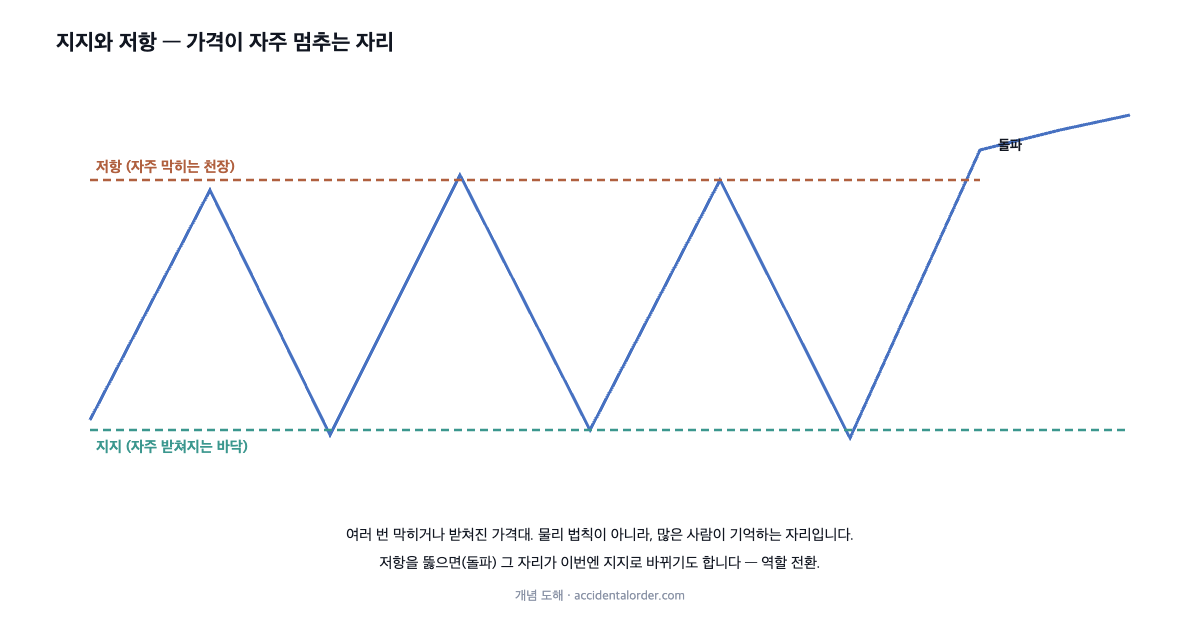
There is a good exercise for first learning support and resistance. Open the weekly chart of a stock you follow, and sketch rough bands across the levels where the price stopped several times over the past one or two years. Then explain to yourself why it stopped there — was it a previous high, a round number, a level where a great deal of trading took place? Simply practising explanation of the past, without straining to predict, naturally gives you a feel for the fact that support and resistance are people’s memories rather than magic.
What support and resistance are
Resistance is a price band that a rising price has repeatedly failed to break through and been pushed back down from. It is a “ceiling,” hard to rise above because many people near that level want to sell. Support is a price band where a falling price has repeatedly been propped up and turned back. It is a “floor,” hard to fall below because many people near that level want to buy. The zone in which a price moves up and down between support and resistance is commonly called a “trading range” or a sideways market.
What matters is that support and resistance are not exact points but approximate “zones.” Rather than precisely KRW 90,000, think of a band with width — somewhere around KRW 89,000 to 91,000. Taking a ruler to the chart and drawing a precise line is itself an invitation to delusion, because support and resistance are psychological areas, not physical boundaries.
Why support and resistance form — levels of memory
Support and resistance arise not from magic but from people’s memory and psychology. If many people bought at a certain value, that value is imprinted on them as “break-even.” When the price falls below it and then comes back up near break-even, selling emerges from those wanting to avoid a loss, and resistance forms. Conversely, if the price has bounced several times at a certain value, people remember “this is the floor,” buy near it, and support takes shape.
Support and resistance are therefore self-fulfilling in character. If many people believe “this is support” and buy at that level, buying pressure really does appear there and it becomes support. It is the same principle as when we discussed the support and resistance of moving averages earlier. Support and resistance work for as long as this psychology holds force, but the moment participants’ attention moves elsewhere or new information arrives, that force can vanish. Support and resistance are traces of crowd psychology, not laws of physics holding prices in place.
Real data — KT&G’s trading range and breakout
Let us look at an actual case. Below is KT&G’s weekly chart for 2024 (KRX). Throughout the first half of the year the share price moved up and down inside a range of roughly KRW 84,000 to 94,000.
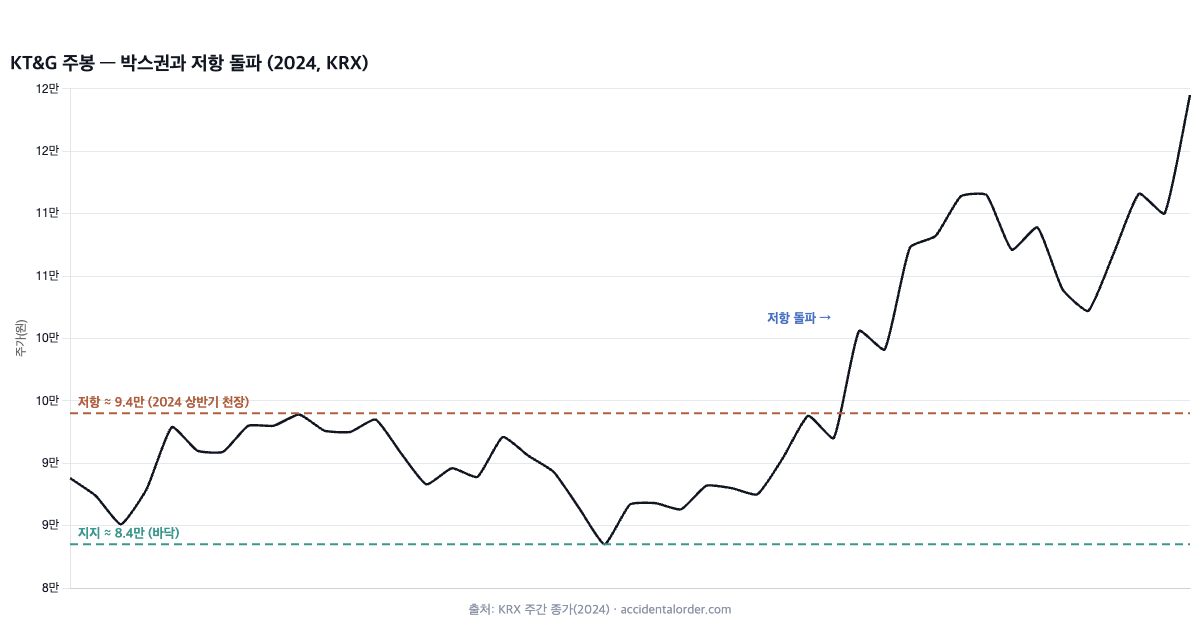
The area around KRW 94,000 was resistance, struck several times and pushed back from; the area around KRW 84,000 was support, the floor from which rebounds began. Then, in the second half of 2024, the price broke above that resistance and went on to the KRW 100,000 and 110,000 levels. Clearing a long-standing resistance in this way is called a “breakout,” and when volume comes with it, the breakout is regarded as more credible. The perspective on “moves backed by volume” covered in the article on candlesticks and volume carries over here.
Yet this picture, too, is clear only after the fact. While the price was inside the range, there was no way to know in advance whether the range would break upward or downward. In reality, “false breakouts” — where the price appears to leave the range only to return inside it — are common. On the left-hand side of the chart (the past), support, resistance and breakouts are unmistakable; at the right-hand edge (the present), a genuine breakout is indistinguishable from a false one.
Role reversal — resistance becomes support
One intriguing property of support and resistance is role reversal. Once a long-standing resistance is broken through to the upside, that level tends to turn into support. After KT&G’s KRW 94,000 was cleared, the same area could later become a level that props the price up when it returns there. Conversely, when support breaks and the price moves below it, that level turns into resistance. In people’s memory a “broken ceiling” is reinterpreted as “the new floor.”
This role reversal shows once again that support and resistance are products of psychology rather than fixed walls. The same price band can serve as ceiling or floor depending on the situation. Declaring that “this line will never break” is therefore dangerous. Support and resistance are areas to keep in mind, not boundaries that cannot be crossed.
Trend lines and channels — sloping support and resistance
Support and resistance need not be horizontal. In an uptrend the lows rise together, so a sloping line joining those lows acts as support. That is an uptrend line. In a downtrend, conversely, a line joining the highs becomes resistance. Draw two such lines in parallel, above and below, and you get a “channel” within which the price moves.
Trend lines and channels organise the flow visually, but they carry over the subjectivity problem noted in the earlier article on moving averages. The line changes depending on which lows you join, and you can pick the best-fitting line after you already know the outcome. The more sloped the support or resistance, therefore, the less objective the judgement that “this line held” or “this line broke.” They are useful as reference sketches, but too weak a foundation on which to build trading rules.
What makes support and resistance strong
Not all support and resistance carries the same weight. Broadly, three things make a level strong. First, the more times it has been struck, the stronger it is. A resistance that has turned the price back three times is remembered by more people than one that did so once. Second, the more volume there was at the level, the stronger it is, because that many more people either bought there or got stuck there. Third, the longer a level has held, the stronger it is.
But even “strong” support and resistance is ultimately relative. However many times a support has held, it will break without resistance if the company’s fundamentals collapse or a serious piece of bad news arrives. The stronger the level, the greater the trust placed in it — and the greater the shock when it breaks. The belief that “this support is strong, so it will never break” can therefore be the more dangerous position.
Reading support and resistance together with volume
Support and resistance become richer when read alongside volume. A break above resistance on heavy volume is regarded as a more credible breakout, while a breakout that slips through without volume invites suspicion of a false move. Likewise, a rebound near support accompanied by rising volume is read as a sign that buying pressure is behind it. All of this, however, is a matter of “slightly higher odds” — not a confirmed signal.
The traps of range trading
“Buy at support, sell at resistance” sounds appealing to beginners, because the rule is simple and looks unambiguous on the chart. But there are several traps here. A range must break at some point, and if you bought at support and that support gives way, losses mount. And if the range is narrow, transaction costs can exceed the spread between support and resistance.
Above all, you cannot know in advance when or in which direction the range will break. Range trading therefore easily becomes a structure that “is right most of the time and badly wrong once” — accumulating small gains repeatedly and then losing all of them in a single breakout. This is one reason why this site puts judgement about the business and the financials ahead of trade timing.
Previous highs, previous lows and round numbers
Certain levels make particularly strong support and resistance. A previous high (the past peak price) tends to become powerful resistance, because those who got stuck at that value want to sell at break-even. A previous low (the past trough) tends to become support. And neat round numbers such as KRW 100,000 or KRW 50,000 frequently act as psychological support and resistance, because people take such simple figures as reference points. Here too the basis is psychology, not any special power residing in the value itself.
What this article does not say
This article does not say that “a particular price band will necessarily act as future support or resistance,” or that “buying at support makes the price go up.” Support and resistance are merely psychological areas that many people remember, not laws of physics holding prices in place. Strong support breaks without resistance on a single piece of bad news, a trading range can break upward or downward, and false breakouts are common. Which line will turn out to be support or resistance in future becomes clear only after the fact. Support and resistance are tools for marking the levels at which people reacted in the past, not prophecies of future prices.
So what are support and resistance good for?
If not prediction, then what is the use? First, grasping context. Knowing where the current price sits within a long-standing range, or whether it is near an important previous high, helps you understand market conditions. Second, a reference for execution. When buying a stock you have already decided to buy, you can use the flow to refine your entry and phase your purchases rather than stepping in just below strong resistance. Third, a benchmark for risk management. Some use it as a line for managing losses, in the form of “if this support breaks, I will treat my judgement as having been mistaken.”
The core point is always the same. Support and resistance are not tools for deciding what to buy; they are aids for executing a judgement already reached from the business and the financials, and for reading context. Lines on a chart do not make decisions for you — they help you handle decisions you have already made with more care.
Support, resistance and fundamentals
Finally, it is worth remembering that support and resistance on a chart and the value of a company belong to different layers. Even if a stock is sitting above “strong support,” that support will eventually break if the company’s business is falling apart. Conversely, if a fundamentally solid company has temporarily dropped below support, that may well be an opportunity. To emphasise it once more: lines on a chart are the memory of prices, while a company’s real value lies in its financial statements.
So when looking at support and resistance, ask why this price is being supported, from the standpoint of the business. Whether it is merely a level people remember, or whether the value really is cheap relative to asset value or earnings, are two different things. Where support on the chart and support in value overlap is as close as one gets to a floor worth trusting.
Support and resistance on which time frame?
Support and resistance also differ in weight depending on the period of the candles. A support that has held for several years on monthly or weekly charts is heavy, because many people have remembered it for a long time; a support formed within a few hours on an intraday chart is light. For a long-term investor, the major support and resistance on weekly and monthly charts is meaningful, while the small lines on intraday charts are mostly noise. So when reading support and resistance, first check whether it is a line on a time frame that matches your investment horizon.
When support and resistance from several time frames overlap at the same price band, that level becomes stronger. If a weekly previous high, a round number and a moving average all converge on one price band, many participants pay attention to that level at once. Such “overlapping levels” are regarded as slightly more likely to draw a market reaction — but this too is a tendency, not a guarantee.
Support, resistance and risk management
One of the most honest uses of support and resistance is as a benchmark for risk management: a reference line for controlling losses, in the form of “if this support clearly breaks, my judgement is probably wrong, so I will respond.” This is not about using support and resistance to predict the future, but about deciding in advance how to respond when you are wrong. It becomes the practical tool for the “size you can bear” and “preparing for the worst-case scenario” covered in investment risk.
Care is still needed when using a support line as a stop-loss level, though. If many people place their stops just below the same support, then when that level gives way the stops all fire at once and the price can momentarily overshoot to the downside (“stop hunting”). So treat the line as a reference, and keep enough latitude not to pile mechanically into exactly the same spot as everyone else.
Why support and resistance feel so convincing
There is a reason support and resistance feel especially persuasive to beginners. Look at a past chart and the instances where the price stopped at a particular line jump out clearly. But this shares its root with the illusions repeated in earlier articles. Our eyes remember the cases that hit the line and forget the ones that missed. And by mistaking a “zone” with width for a precise “line,” we feel that it fits better than it actually does.
An evidence-based attitude keeps its distance from that plausibility. The clearer support and resistance appear, the more one has to ask: does this really have predictive power, or does it merely explain the past well? Knowing a tool and over-trusting it are entirely different things — a principle this track has kept from the candlestick article onwards.
Breakouts and false moves — the difficulty of confirmation
A breakout above resistance is dramatic and so attracts particular attention, but distinguishing a genuine breakout from a false one in real time is extremely difficult, because prices frequently edge past resistance only to fall back inside. Some therefore adopt confirmation conditions: did the closing price clearly clear the resistance, was there volume behind it, has it held for several days? But even when all these conditions are met the price sometimes returns, so confirmation raises the odds without ever conferring certainty.
In the end, breakouts too become clear only after the fact. Wait for confirmation and the price has already risen a long way; chase in a hurry and you fall for the false move. This dilemma stems from the essential nature of support and resistance as lagging observational tools. Rather than putting blind faith in a breakout as a trading signal, it is safer to use it as contextual information: “the price is currently near a long-standing resistance.”
A checklist for reading support and resistance
- See them as zones: bands with width, not precise lines.
- Match the time frame: is this a line on the candle period (weekly, monthly and so on) that fits your horizon?
- Gauge the strength: has the level been struck several times, on heavy volume, and held for a long time?
- Read them with volume: was there trading behind the breakout or the rebound?
- Reference, not prediction: a benchmark for context and risk management, not a wall that determines the future.
Frequently asked questions (FAQ)
Q1. How do I draw a support line?
Mark, as a rough band, the levels at which the price was propped up several times in the past. Think of it as a zone with width rather than an exact point. Since subjectivity enters into which points you join, however, it is important not to believe that there is a single “correct line.”
Q2. Can I not just buy at support and sell at resistance?
It is not that simple. Support can break at any time, and when it does the losses can be large. Range trading may look plausible, but in the face of breakouts, false moves and transaction costs it struggles to produce stable returns. It is safer to judge what to buy from the business and the financials.
Q3. Should I buy into a breakout?
Whether a breakout is genuine or false is knowable only after the fact, so chasing breakouts carries considerable risk. A breakout on heavy volume is said to be more credible, but this too is a matter of probability rather than a guarantee. Rather than treating a breakout as a “signal” to trust blindly, see it as one element of the context.
Summary
Support and resistance are psychological levels at which prices have often halted or turned back. They arise from people’s memory and psychology, and work in a self-fulfilling way — but they disappear once attention moves elsewhere. Role reversal, in which broken resistance turns into support, and the psychological force of previous highs and round numbers, follow the same principle. Yet no line guarantees the future, and false breakouts and sudden collapses are common. Using support and resistance as a reference for context, execution and risk management rather than for prediction is what the evidence supports. The next article covers RSI and MACD, the representative indicators that process price and volume through formulas. We will set out what these indicators calculate, and how conventional wisdom such as “buy at RSI 30, sell at 70” fares against the actual evidence, again keeping the principle and its limits apart.
Investing fundamentals · technical analysis. This article is for information only and is not a recommendation to buy or sell any particular security. Prices are based on KRX public data and may have changed since the time of writing (July 2026).