The Principles of Diversification: Correlation Is What Matters
Few concepts are as widely assumed to be understood, and as widely misunderstood in practice, as diversification. Open an account belonging to someone who believes they are diversified because they hold twenty stocks and you will often find ten semiconductor names and ten battery names. The number of stocks is twenty; the number of bets is effectively two. This article deals with the real question of diversification — not “across how many did you spread it?” but “across how many things that move differently from one another did you spread it?”
If the earlier piece on asset allocation asked “what should be mixed with what?”, this one covers the mathematics and the practice of “why, and by how much, does mixing help?” We will look in turn at the core concept of correlation, the relationship between the number of holdings and risk, and the moment diversification betrays you.
1. Correlation: the raw material of the diversification effect
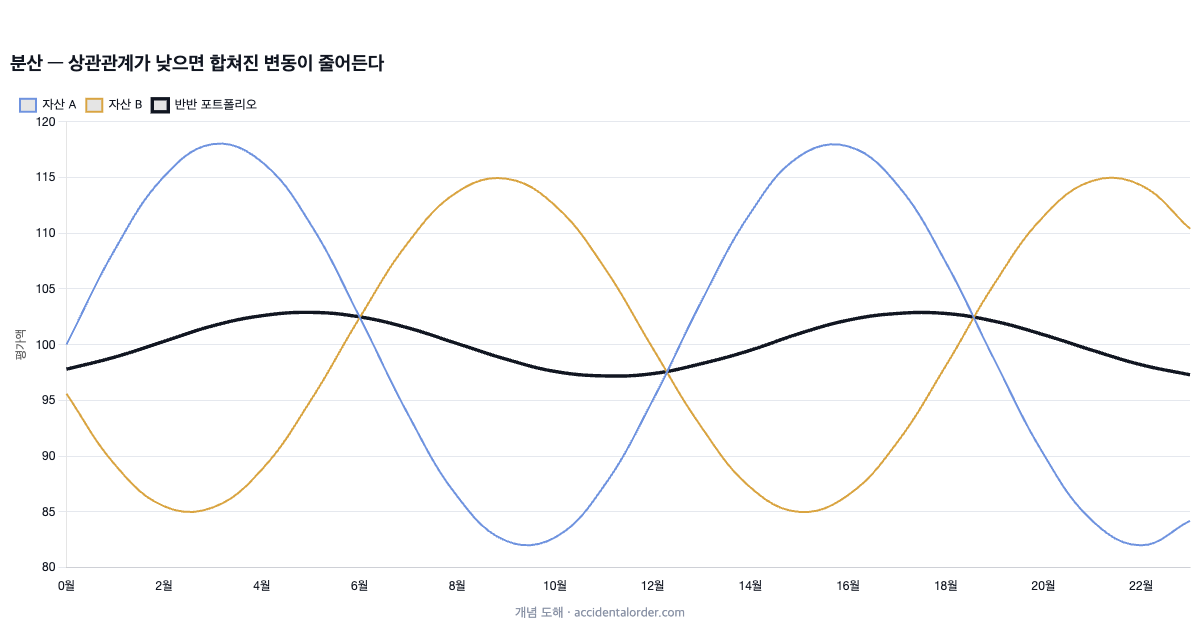
The correlation coefficient measures the degree to which two assets move in the same direction, on a scale from -1 to +1. At +1 they move entirely together, at 0 independently, at -1 in exactly opposite directions. The size of the diversification effect depends entirely on this value. No matter how finely you slice assets with a correlation of +1, total volatility stays the same. Only when you mix assets with low correlation does the magic appear in which “the whole shakes less than the average of the parts”.
To get a feel for it, here is how portfolio volatility changes with the correlation coefficient when two assets, each with annual volatility of 20%, are mixed half and half.
| Correlation between the two assets | Volatility of the 50/50 portfolio | Reduction effect |
|---|---|---|
| +1.0 | 20.0% | None |
| +0.5 | 17.3% | -14% |
| 0.0 | 14.1% | -29% |
| -0.5 | 10.0% | -50% |
| -1.0 | 0% | Complete offset (in theory) |
The expected return stays at the average of the two assets while only volatility falls. That is why diversification is called the only “free lunch” in finance — more precisely, it is close to the only way of reducing risk without giving up return.
2. The truth about the number of holdings: a game that ends at 20–30
The risk in an individual stock comes in two layers. Systematic risk, which arises because the whole market moves, and unsystematic risk, which comes from that one company’s own circumstances (an earnings shock, litigation, management risk). Diversification can erase only the latter, and the conclusions of the classic studies run roughly as follows.
| Number of holdings (randomly selected) | Portfolio volatility (approx.) |
|---|---|
| 1 | Approx. 45–50% |
| 5 | Approx. 27% |
| 10 | Approx. 24% |
| 20–30 | Approx. 20–21% |
| 500 (the whole market) | Approx. 19% |
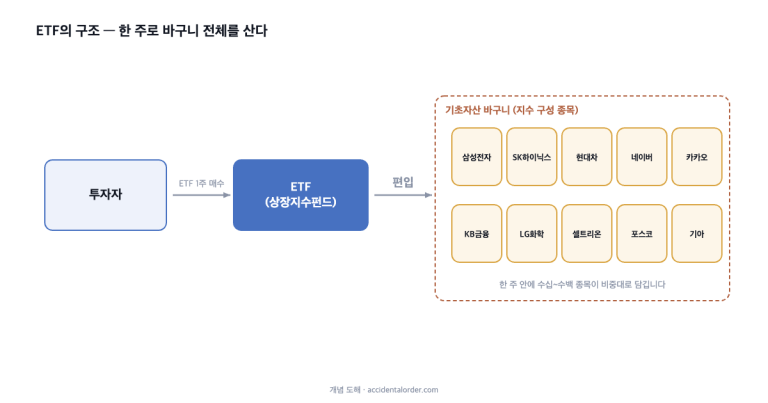
With 20 to 30 randomly chosen stocks most of the unsystematic risk disappears, and beyond that point holding a hundred names barely reduces it further. What remains is market risk — which cannot be erased by spreading across stocks, and belongs to the domain of asset allocation. Turned around, it also means that rather than going to the trouble of managing dozens of individual names, a single index ETF holding the whole market is often more efficient.
3. The three axes of diversification
Axis 1: asset classes — the most powerful form of diversification
Correlations between individual stocks, however low they get, sit at around 0.3 to 0.7, whereas correlations between asset classes fall towards zero or into negative territory. Combinations such as equities and government bonds, or equities and gold, behave that way. For the same effort, diversifying across asset classes produces a far larger effect than diversifying across stocks. That is why the order of priority in diversification is “asset classes first, individual stocks second”.
Axis 2: region and currency
If you invest only in domestic assets, then no matter how many stocks you hold you are exposed to a single bundle of variables: the Korean economy, the won, and Korean regulation. Mixing in overseas assets dilutes this country risk, and in periods of won weakness the currency gain can act as a cushion (conversely, a strong won is a headwind — whether or not to hedge the currency is the switch that adjusts this exposure).
Axis 3: time — what regular instalment investing really is
Putting a lump sum in all at once amounts to betting on a single variable: the moment of purchase. Buying in monthly instalments spreads the purchase price along the time axis and structurally eliminates the worst-case scenario of “buying the whole lot at exactly the top”. Statistically, lump-sum investing (which stays exposed for longer in a rising market) has the better average outcome, but the pain along the worst path is far shallower with instalments. Choosing a path you can endure, rather than the best average, is also part of diversification.
4. The moment diversification betrays you
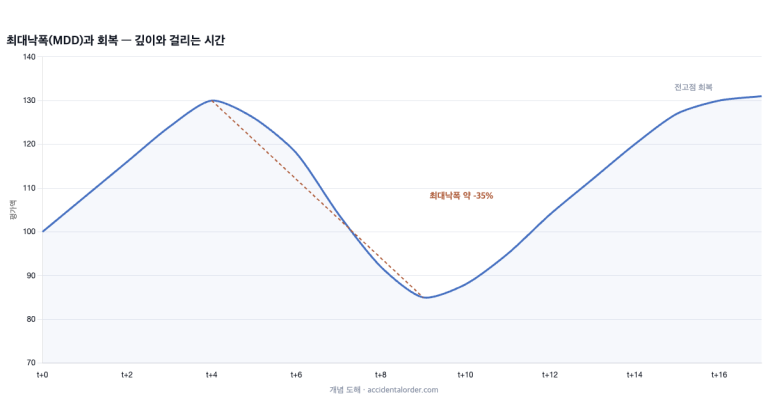
The correlation coefficient is not a constant. Assets that normally sit at 0.3 spike to 0.9 in a panic — in the autumn of 2008 and in March 2020, equities, corporate bonds, REITs, commodities and emerging-market assets were all sold as one bundle. In a liquidity crisis, the logic of “sell whatever you can sell first” takes over correlation. So the last line of defence in a diversified portfolio is not correlation but cash and top-quality government bonds, which hold their value even in a crisis, plus an investment size that was bearable in the first place. This is precisely where the conclusion of the piece on risk meets it.
5. Three common traps
First, fake diversification — three similar funds with different names are one fund. Check whether their top ten holdings overlap. Second, over-diversification — a state in which assets are chopped so finely that no judgement you make can affect performance. If you line them up and find a crowd of positions weighing less than 1%, they are candidates for clearing out. Third, collecting under the name of diversification — twelve ETFs bought one at a time as each theme came into fashion are not a portfolio, they are a drawer. If you cannot explain the whole thing when you draw it on a single page, it is not a design.
6. A spoonful of maths: where the diversification effect comes from
The variance (volatility squared) of a portfolio that mixes two assets half and half is not “the average of each asset’s variance” but that plus a correlation term. Mix two assets each with volatility of 20% half and half and portfolio variance = 0.25 × (20²) + 0.25 × (20²) + 2 × 0.25 × correlation × 20 × 20. If the correlation is 1, volatility stays at 20%; if it is 0, √200 ≈ 14.1%; if it is -0.5, 10%. The numbers in the table above come out of this formula.
This formula gives two practical intuitions. First, the diversification effect grows not as you add assets but as you add assets with low correlation — because that final term is everything. Second, even a highly volatile asset lowers portfolio risk if its correlation is low enough. Gold is a good example. Gold itself swings by around 15% a year, but its correlation with equities is low, so there are ranges in which adding a small amount to an equity portfolio actually brings total volatility down.
7. A feel for the real numbers: how much do assets actually move together?
Let us get a feel for roughly where real-world assets sit on the textbook spectrum of -1 to +1 (these are rough long-run averages and change substantially depending on the regime).
| Asset pair | Long-run correlation (approx.) | Notes |
|---|---|---|
| Korean equities ↔ US equities | +0.6–0.7 | Rising trend as markets synchronise globally |
| Large caps within the same sector | +0.7–0.9 | Where stock-level diversification hits its limit |
| Equities ↔ government bonds | -0.3–+0.3 | Negative when inflation is low, positive in inflationary regimes |
| Equities ↔ gold | Around 0 | A history of being useful in crisis regimes |
| Equities ↔ the dollar (in won terms) | Tends to be negative | Dollar strength cushions in a crisis |
| Equities ↔ bitcoin | +0.3–0.6 (recently) | Behaves like a risk asset, contrary to the “digital gold” narrative |
The fifth row is especially important for Korean investors. When an investor whose base currency is the won holds US assets without a currency hedge, dollar strength (won weakness) has offset part of the loss when share prices fall in a global crisis — that was true in both 2008 and 2020. It is why the same US equities behave differently in a crisis depending on whether they are currency-hedged or currency-exposed, and why overseas assets provide a double diversification (asset plus currency) for someone who holds only won assets.
8. A case study: the 2010s, a Korea-concentrated account and a globally diversified one
The value of diversification shows up in periods when the humility of “I do not know which side will rise” turns out to have been right. The roughly ten years from 2011 to 2020 are the textbook case. The KOSPI was near 2,200 in 2011 and then sat trapped in a range of 1,800 to 2,100 until 2016 (the so-called “box-pi”), delivering only around 3–4% a year even including dividends. Over the same period the S&P 500 roughly tripled — around 13% a year including dividends.
There was no way for an investor in 2011 to know this future. At the time the dominant narrative was that “the US was the epicentre of the financial crisis and emerging markets are the centre of growth”. The difference between a Korea-concentrated account and a 50/50 diversified one was not forecasting ability but structure — the diversified account was built so that half of it would ride whichever narrative won, while the concentrated account was built as a ten-year bet on a single narrative. Of course, the opposite case has to be recorded fairly too. In stretches when the Korean market surged, such as 2020–2021, the diversified account lagged. Diversification is not a strategy that always wins; it is a strategy that erases the cases where you lose badly.
Frequently asked questions
Q. Samsung Electronics alone is 60% of my account. How should I diversify?
You do not have to sell it all at once. Start by allocating every new contribution to other asset classes, and the weight dilutes naturally without any selling. What is urgent is not swapping the stock but dismantling a structure in which the whole account takes a -30% hit if that one name halves. Set a target weight (say, no more than 20% in a single stock) and a deadline for reaching it, and move there in stages.
Q. Does buying several ETFs make me diversified?
It does if the contents differ. An S&P 500 ETF and a Nasdaq 100 ETF overlap heavily in their top holdings and are effectively one body. The quickest way to check the overlap is to put the top ten holdings of each ETF side by side — if more than half overlap, that is duplication, not diversification.
Q. How many asset classes are enough?
Both academically and in practice, four to six with clearly different characteristics (domestic equities, overseas equities, bonds, cash, and optionally gold and REITs) secure most of the diversification effect. Subdividing further has a small marginal effect relative to the cost of managing it. Rather than increasing the number of asset classes, it is better to check whether the correlations between the boxes you already have are genuinely low.
Summing up
In summary: the currency of diversification is not the number of holdings but correlation. The most powerful form of diversification is across asset classes; 20 to 30 stocks (or a single index) is enough for stock-level diversification; and diversification across time erases the worst path. And because diversification itself wobbles in a real crisis, you need that final layer called cash.
With this article the skeleton of the investment basics series — compounding → risk → asset allocation → diversification — is complete. If you are curious about the tools that actually fill in this skeleton, carry on to the piece on ETFs; if you are curious about the market’s blind spots, go to the piece on overlooked stocks. Views are welcome at any time via the contact details on the about page.
This article is intended as general information and does not recommend the purchase or sale of any particular product. Investment decisions and their consequences rest with the investor.