Osung Advanced Materials (052420) analysis: profits surged — is it sustainable?
This is a stock analysis, taking listed companies apart one at a time. It is not a recommendation to buy or sell any particular stock, and all figures are as at the time of writing (July 2026) and may change thereafter. Core scenario: the 2024 surge in profit is not a one-off but continues, and the company grows without further dilution — this thesis is updated every quarter in stock tracking.
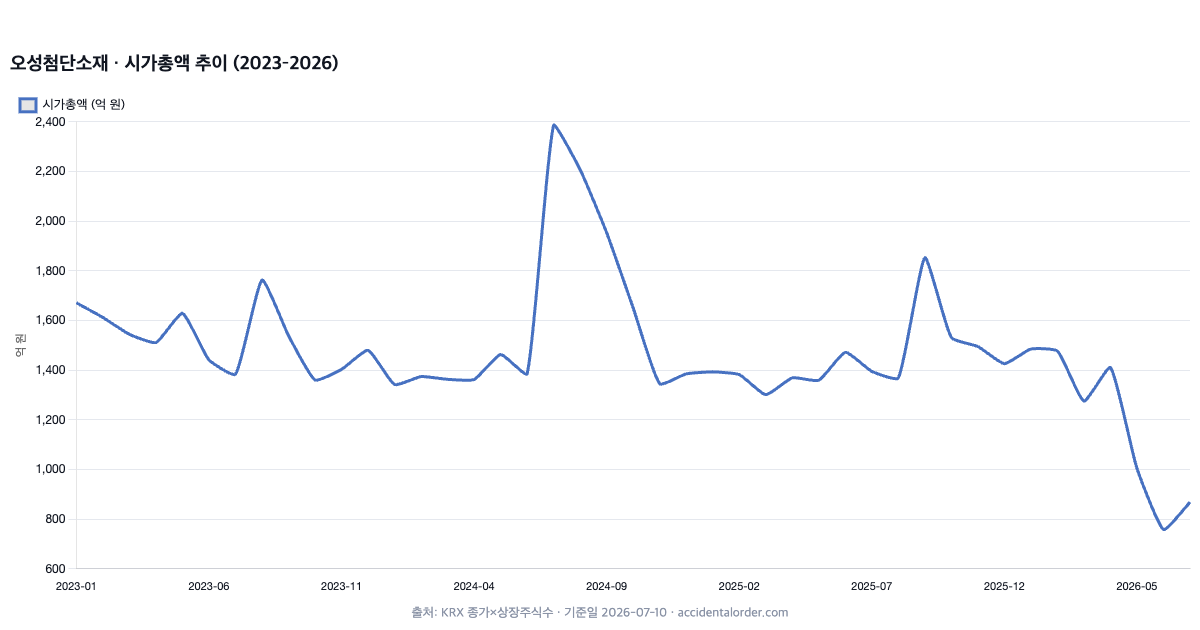
Osung Advanced Materials makes materials such as synthetic resins and films. It has a history of large share price swings driven by new-material themes such as solar power and secondary batteries. Its 2024 results are impressive. Revenue rose 40% year on year to KRW 146.4bn, and operating profit rose 75% to KRW 22.2bn. Market capitalisation is KRW 86.8bn, PBR about 0.36x and PER 7.3x. When looking at this company, however, there is something that has to come before the performance figures: why profit rose, and how the share count has grown over time.
How it makes money
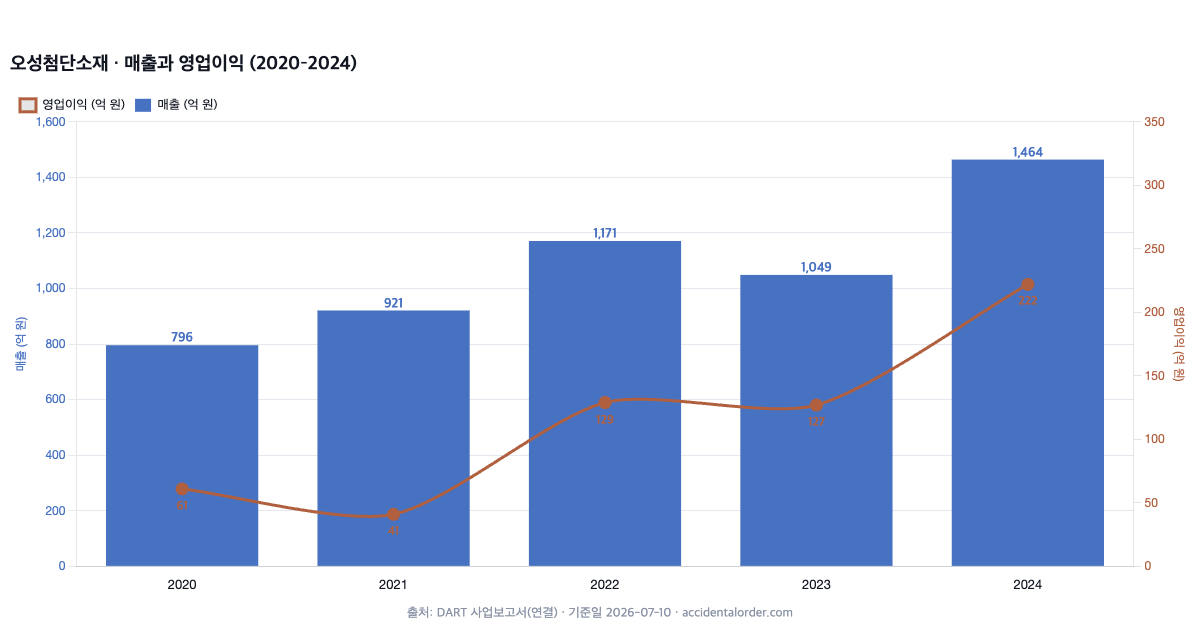
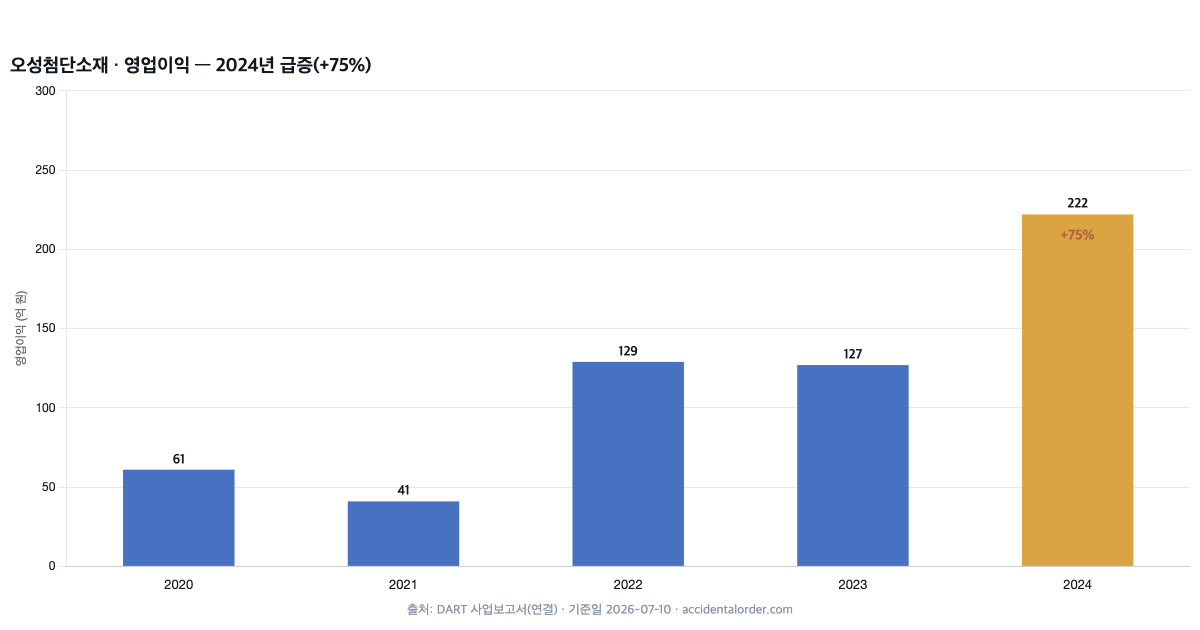
The core business is materials. Synthetic resin products form the base of revenue, with a new-materials business attached to it. Revenue grew from KRW 79.6bn in 2020 to KRW 146.4bn in 2024, and the 2024 leap in particular stands out. Operating profit also jumped, from KRW 12.7bn in 2023 to KRW 22.2bn in 2024. The question is whether that leap is something that can be repeated structurally, or a special factor of one particular year.
Osung Advanced Materials is a KOSDAQ (Korea’s growth-company market) company making materials such as synthetic resins and films, and it also has a track record in new materials related to solar power and secondary batteries. That new-materials history is why it was classified as a theme stock in the past and saw its share price swing violently. The ownership structure is on the weak side. The largest shareholder, East Burgundy Co., Ltd., holds 10.25% and Polar Vertex Co., Ltd. 9.42%, so the combined stake on the largest-shareholder side comes to only about 19.7%. Weak control means high volatility around management rights and fundraising, and that dovetails with the dilution history discussed below.
Five-year results summary (KRW bn)
| Year | 2020 | 2021 | 2022 | 2023 | 2024 |
|---|---|---|---|---|---|
| Revenue | 79.6 | 92.1 | 117.1 | 104.9 | 146.4 |
| Operating profit | 6.1 | 4.1 | 12.9 | 12.7 | 22.2 |
| Net profit | 10.4 | −11.5 | 2.4 | 12.0 | 12.0 |
In 2024 revenue jumped about 40%, from KRW 104.9bn to KRW 146.4bn, and operating profit surged about 75%, from KRW 12.7bn to KRW 22.2bn. On the surface figures alone, this looks like a strong growth stock. But the crux of judging this company is that net profit has swung widely in the past — including a loss of KRW 11.5bn in 2021 — and what the source of the 2024 surge actually was. The finances, by contrast, are solid: assets of KRW 297.1bn consist of liabilities of KRW 54.2bn and equity of KRW 242.9bn, so the debt-to-equity ratio is only about 22% and PBR is about 0.36x (market capitalisation ÷ total equity).
The pressure points — the durability of earnings and the dilution history
Two things are the pressure points for this stock. First, the source and durability of the profit surge. Net profit was a loss of KRW 11.5bn in 2021 before recovering, and 2024 operating profit surged. Whether that surge is a structural improvement from expanding downstream demand, or comes from a particular product or a one-off factor, has to be checked against the product-level revenue and the profit and loss items in the annual report. If it turns out to be a one-off, that fact itself becomes the thesis — “does the profit hold up next year?”
Second, the dilution history. Of the 100 disclosures filed over the past 24 months, six relate to rights issues and six to convertible bonds (CBs). Repayments and conversions of convertible bonds also show up in the cash flow statement. Frequent fundraising and CB conversion increase the share count and dilute the share belonging to existing shareholders. On top of that, with the largest-shareholder side holding a combined stake of only about 19.7%, control is weak and volatility around management rights and fundraising is relatively high. There is no dividend either.
The first pressure point is the sustainability of earnings. It has to be established whether the 2024 surge in operating profit (+75%) came from a structural improvement in a particular product or in downstream demand, or from a one-off factor. The key is to cross-check the product-level revenue in “II. The Business” section of the annual report against the non-operating items in the income statement, to see whether this profit will continue into 2025. If it proves to be a one-off, the low PBR becomes a trap.
The second pressure point is share count dilution and overhang. Of the 100 disclosures filed over the past 24 months, 18 are material-fact reports, six are rights issues and six are convertible bonds (CBs). The cash flow statement carries items such as “repayment of convertible bonds, KRW 3bn” and “conversion of convertible bonds, KRW 3.1bn”. A record of frequent fundraising and conversion increases the share count and dilutes the share belonging to existing shareholders, and unconverted paper remains as an overhang that could come to market at any time. Combined with a weak ownership structure (a combined 19.7%), that risk grows larger still.
The core scenario and what would disprove it
The thesis this piece is backing is as follows. The 2024 surge in profit (operating profit +75%) is not a one-off but continues into 2025, and the company grows on its own equity without dilutive fundraising such as further CBs or rights issues. This thesis is updated every quarter in stock tracking. If profit falls back to the 2023 level (operating profit of about KRW 12.7bn), or dilutive fundraising resumes, the thesis is discarded.
Bull case
The bull case is the combination of improving results with a low valuation and low debt. Revenue and operating profit jumped 40% and 75% respectively in 2024, strengthening the underlying fitness of the materials business; the debt-to-equity ratio is 22% and PBR is only 0.36x. If the profit surge is not a one-off but structural growth built on demand for new materials, then the picture that stands up is of an undervalued company growing on its own equity without further dilution.
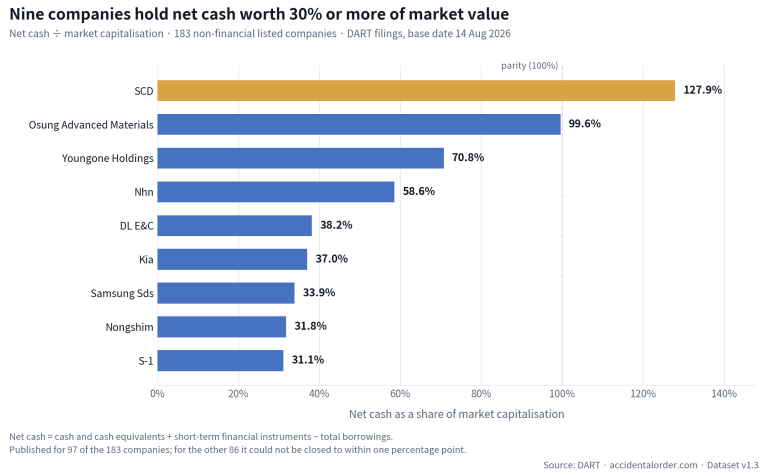
① The size of the improvement — revenue +40% and operating profit +75% in 2024 are changes that are hard to ignore. If that trend continues, a PER of 7.3x is low. ② Undervalued against assets — PBR of about 0.36x and cash and cash equivalents of KRW 82.2bn mean the finances are not bad. ③ The new-materials option — if downstream industries revive, the new-materials business could act as leverage on results.
Bear case
The bear case is the uncertainty of earnings and the risk of dilution. If the 2024 profit surge proves to be a one-off and operating profit falls back to the 2023 level (about KRW 12.7bn), the premise of growth collapses. Add a resumption of frequent CBs and rights issues and share count dilution offsets the appeal of the low valuation. With no dividend there is no downside support from shareholder returns either, and the history as a theme stock leaves it exposed to volatility unrelated to results.
① Dilution risk — repeated rights issues and CBs have continuously diluted shareholder value. Even with good results, if the share count rises, per-share value can stand still. ② Earnings volatility — net profit has a history of swinging between losses and profits, so it is too early to treat the 2024 results as a trend. ③ Ownership structure and theme history — weak control and a past as a theme stock magnify share price volatility unrelated to results. With no dividend, there is no reward for waiting either.
Quarterly checkpoints
| When to check | What to check | Condition for the thesis to hold |
|---|---|---|
| 2026-08 (Q2) | Operating profit | The profit surge continues (no reversion to the 2023 level) |
| Ad hoc disclosures | Rights issues and CBs | No new dilutive fundraising |
| Annual report | Product-level revenue | Confirmation of whether the source of the profit surge is structural |
What to watch next quarter
There are two things to look for in the August half-year report (banyeon bogoseo, filed within 45 days of the H1 close, covering Q2 results). ① Whether the profit surge holds rather than falling back to the 2023 level. ② Whether there is any new dilutive fundraising such as a rights issue or convertible bond. These two are the key variables in this stock’s scenario. Once the results are out we will update this piece and stock tracking.
Correction (2026-07-13): the PBR was originally published as 0.69x, which was an error arising from understating consolidated total equity (about KRW 242.9bn). Total assets of KRW 297.1bn = liabilities of KRW 54.2bn + equity of KRW 242.9bn, so the actual PBR is about 0.36x (market capitalisation of KRW 86.8bn ÷ equity of KRW 242.9bn) and the debt-to-equity ratio about 22%. This is a correction that, if anything, strengthens the low-valuation, low-debt reading.
Sources and disclosures
The financial figures were verified in DART electronic disclosures (Osung Advanced Materials 2024 annual report, consolidated basis) and in the material-fact reports of the past two years. The share price and market capitalisation are based on the closing price of 2026-07-10 and will move after publication. This article is for information purposes and is not a recommendation to buy or sell any particular stock.
Update log
- 2026-08-15 — FY2026 half-year update — FY2026 half-year report filed — revenue KRW 22.9bn (KRW 19.7bn a year earlier), operating profit KRW 1.0bn (KRW 2.9bn a year earlier), net profit KRW 155.9bn (KRW 11.5bn a year earlier). Against the threshold that the profit step-up continues and does not return to the 2023 level, the half-year cumulative operating profit is KRW 1.03bn against KRW 2.93bn a year earlier (FY2023 full year KRW 12.7bn, FY2025 full year KRW 30.1bn), so below the threshold. On the no-new-dilution threshold, there were no rights issues, convertible bonds or warrant bonds filed in 2026; the share-related filings on record are a small-scale merger (2026-01-27), the cancellation of 3,410,000 treasury shares (2026-02-11) and a ten-for-one share consolidation (2026-03-06). Status: mixed. → the half-year report · Stock Tracking
- 2026-08-15 — Each company covered here now has its own filing-traceable data page: price-to-book against total equity and against the owners’ share, five years of revenue, profit, equity and net cash, and the dividend, treasury and cancellation record — every figure beside the DART receipt it was read from. → Osung Advanced Materials (052420)
Get the next quarterly update for this company by email
When the next results are filed we send where this scenario stands. Nothing else.