Sewon Precision (021820) analysis: KRW 105.9bn market cap, KRW 376.8bn of current assets left after every debt
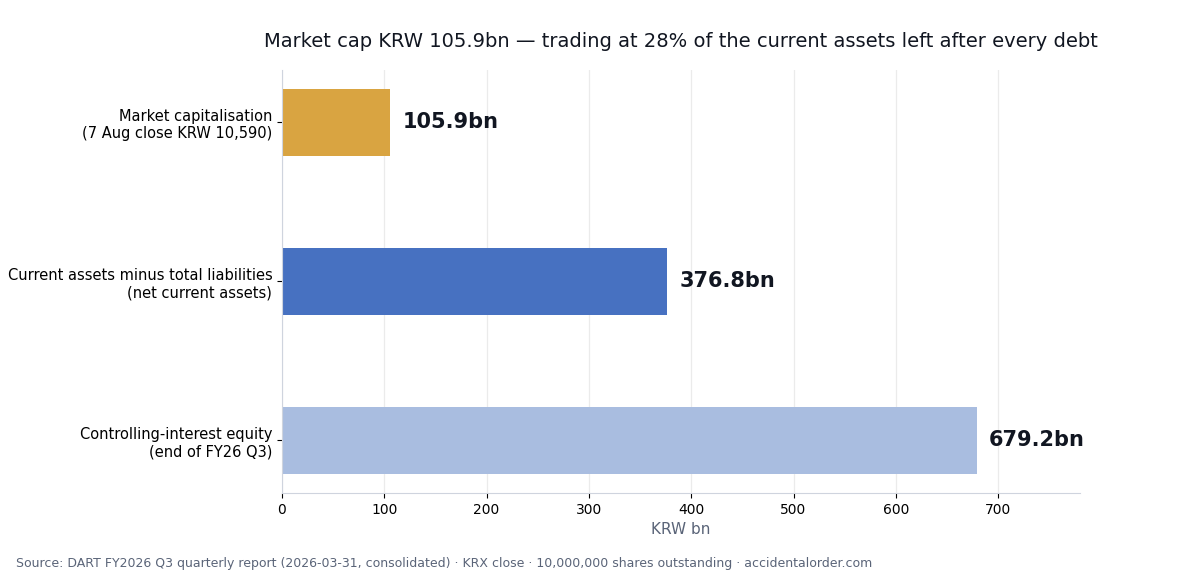
Sewon Precision (021820) has a market capitalisation of KRW 105.9bn. That is the closing price of KRW 10,590 on 7 August 2026 multiplied by 10 million shares outstanding, and there are no treasury shares.
Open the same company’s balance sheet and this is what it says. Current assets KRW 470.0bn, total liabilities KRW 93.2bn. Subtract every debt the company owes from the assets that could turn into cash within a year, and KRW 376.8bn is still left over. That is 3.6 times the market capitalisation. Turn it around: the market is buying and selling this company at 28% of the current assets that remain after all its debts are paid. (Source: DART (Korea’s mandatory electronic disclosure system), FY2026 Q3 quarterly report, consolidated as at 2026-03-31)
This is what Benjamin Graham called a net-net. The question to ask about a stock like this is not “is it cheap”. Cheapness is already there in the table. The questions are why has it stayed at this price for years, and will those assets ever reach shareholders.
First, this company closes its books in June
There is something to settle before the main argument. Sewon Precision is a June fiscal year-end company (in Korea most listed companies close in December, so this one is an exception). Read with eyes accustomed to a December close and it is easy to misread the whole fiscal year. When this piece writes FY2025, it means July 2024 through June 2025, and that annual report was filed in September 2025.
What matters in practice is that information arrives on a different timetable from everyone else’s. While December-closing companies are filing half-year reports in August, this company is quiet. The most recent material we can see now is the FY2026 Q3 quarterly report filed in May 2026 (as at 31 March 2026), and the next one after that is the annual report in September 2026. That lag fixes the date on which the threshold set out below gets checked.
The core business — body parts and dies in the Hyundai Motor chain
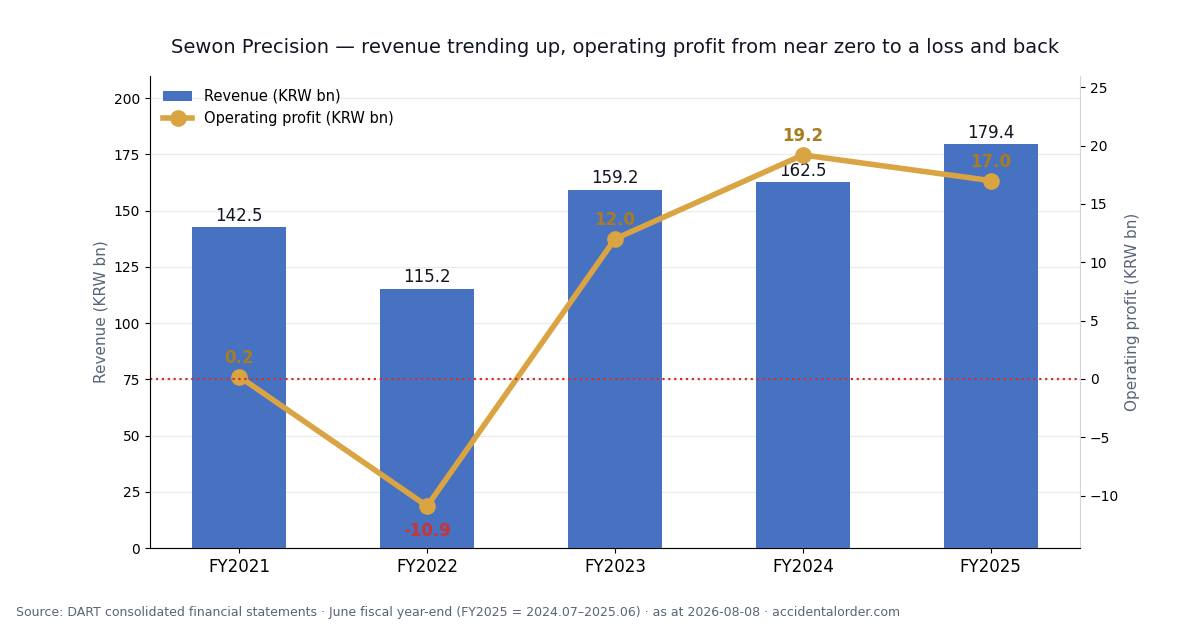
Sewon Precision makes automotive body parts and press dies. It sits inside the Hyundai Motor Group supply chain and has production bases in Korea and China. In FY2025 the utilisation rate of its Korean plants was 89.6%. It is not a glamorous business, but it is an old one, and revenue has grown gently from KRW 142.5bn in FY2021 to KRW 179.4bn in FY2025.
| (KRW bn) | FY2021 | FY2022 | FY2023 | FY2024 | FY2025 |
|---|---|---|---|---|---|
| Revenue | 142.5 | 115.2 | 159.2 | 162.5 | 179.4 |
| Operating profit | 0.2 | −10.9 | 12.0 | 19.2 | 17.0 |
| Net profit (total) | 24.6 | −27.9 | −31.3 | 55.0 | 48.8 |
| Net profit attributable to controlling interests | 24.8 | −11.3 | −9.5 | 55.4 | 46.5 |
| Operating cash flow | 9.2 | 24.6 | 37.0 | 19.0 | 60.4 |
Two things stand out in the table. First, the swing in operating profit is wide. KRW 0.2bn in FY2021, a loss of KRW 10.9bn in FY2022, then up to KRW 19.2bn in FY2024. You can see directly how a parts maker’s results move with the carmaker’s volumes and with unit-price negotiations.
Second, net profit is far larger than operating profit. Look at FY2025 alone: operating profit KRW 17.0bn against net profit KRW 48.8bn. The gap of KRW 31.8bn is close to twice the profit from the core business. Much of that gap is non-operating items such as finance income earned on the assets the company has piled up. In other words, more than half of this company’s profit comes not from selling things but from the storehouse. It is a familiar shape in net-net stocks, and it shows the thickness of the assets and the thinness of the core business at the same time.
The latest numbers — nine months of FY2026
The most recent results available are in the FY2026 Q3 quarterly report (July 2025 to March 2026, nine months cumulative).
| FY2026 (KRW bn) | Nine months cumulative | Same period a year earlier | Change |
|---|---|---|---|
| Revenue | 119.5 | 118.7 | +0.7% |
| Operating profit | 12.3 | 8.9 | +38.2% |
| Net profit (total) | 29.9 | 32.7 | −8.6% |
| Net profit attributable to controlling interests | 26.0 | 31.2 | −16.7% |
On a cumulative basis, operating profit grew. KRW 12.3bn is 38% above the KRW 8.9bn of the same period a year earlier. With revenue essentially flat (+0.7%) and operating profit up, the margin improved.
But take only the most recent quarter and the story changes. Over the three months from January to March 2026, revenue was KRW 38.4bn (against KRW 49.1bn a year earlier) and operating profit was a loss of KRW 0.7bn. The same quarter a year earlier was +KRW 0.2bn, so it swung from profit to loss. The cumulative figure is good and the latest quarter is bad. The two have to be read together; quoting only one of them distorts the picture.
Assets — confirming the net-net in numbers
| End of FY2026 Q3 (2026-03-31, KRW bn) | Amount |
|---|---|
| Total assets | 863.6 |
| Current assets | 470.0 |
| Total liabilities (current 68.5 + non-current 24.7) | 93.2 |
| Net current assets (current assets − total liabilities) | 376.8 |
| Total equity | 770.5 |
| — Controlling-interest equity | 679.2 |
| — Non-controlling interests | 91.3 (11.8% of equity) |
Total liabilities are only KRW 93.2bn. Set against assets of KRW 863.6bn, that is a very low debt ratio. Equity has risen through all five fiscal years to KRW 770.5bn, while over the same period the share price moved the other way.
PBR is calculated on the controlling-interest share
When reading consolidated financial statements, the multiple should be computed on equity attributable to controlling shareholders, not on total equity. Consolidated equity mixes in non-controlling interests — the part of subsidiaries that is not ours. (→ Consolidated vs separate financial statements)
| Metric | On total equity | On controlling-interest equity |
|---|---|---|
| PBR | 0.14x | 0.16x |
| Equity used | KRW 770.5bn | KRW 679.2bn |
Fortunately, at this company non-controlling interests amount to KRW 91.3bn, or just 11.8% of equity. So whether you calculate on total equity or on the shareholders’ share, 0.14x and 0.16x are not far apart. KG Eco Solution, which we covered yesterday, had non-controlling interests at 54% of equity, and its PBR spread more than twofold, from 0.09x to 0.19x. Apply the same calculation to both companies and it becomes clear where this distinction is decisive and where it is trivial.
For reference, on FY2025 net profit attributable to controlling interests of KRW 46.5bn, the PER is about 2.3x.
So why this price
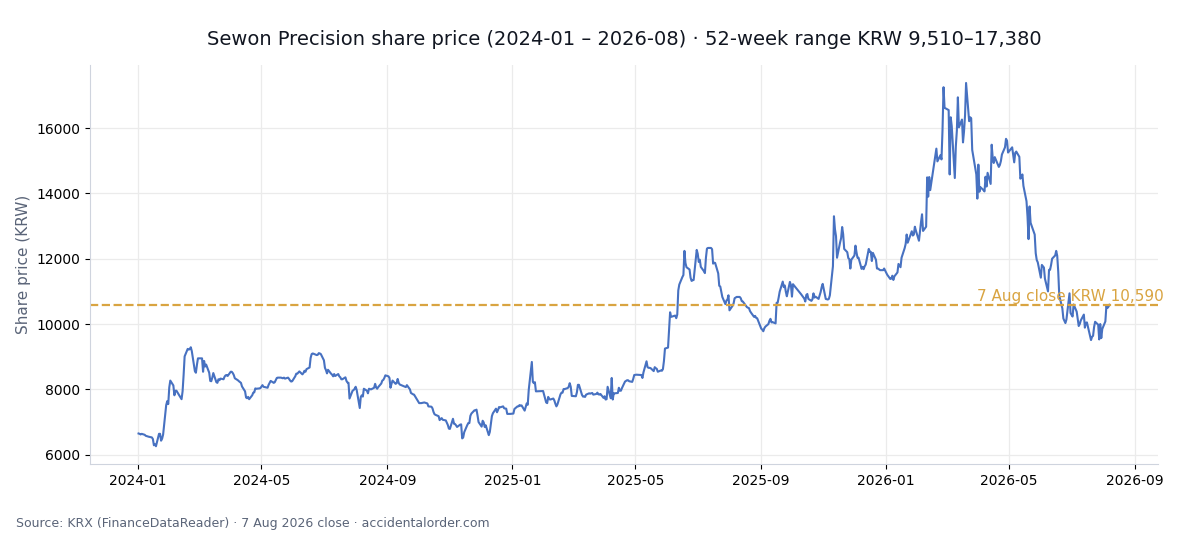
The assets are thick, the debt is small and the company makes a profit, yet the share price has come down from a 52-week high of KRW 17,380 to KRW 10,590. The reasons can be broken into a few parts.
First, trading is extremely thin. Volume on 7 August was 4,207 shares. That is not a size an institution can move in and out of, so in practice there is no one to push the price back to normal. (→ Overlooked stocks and charts — the liquidity trap)
Second, the earning power of the core business is thin. KRW 376.8bn of assets is left over, while FY2025 operating profit was KRW 17.0bn and the most recent quarter was a loss. When the cash the core business generates is small relative to the size of the assets, the market prices those assets as “money tied up” rather than “money that will be used some day”.
Third, those assets reach shareholders slowly. Total dividends in FY2025 were about KRW 2.0bn, roughly 0.5% of the KRW 376.8bn of net current assets. The storehouse is large but the door is barely open. This third point is the real pressure point for this stock, and it is where our scenario hangs.
Dividends have risen three years running
The dividend per share has been raised three years in a row: KRW 100 → KRW 150 → KRW 200 (FY2025). On the 7 August closing price the dividend yield is about 1.9%, and the payout ratio against FY2025 net profit is a little over 4%.
The absolute level is still low. But the direction is upward, and in a net-net stock a dividend increase is the simplest and most easily verified signal of whether assets have begun to flow towards shareholders. That is why we made the threshold the maintenance or increase of the dividend rather than its absolute amount.
Bull and Bear
Bull
A market capitalisation of KRW 105.9bn against net current assets of KRW 376.8bn and controlling-interest equity of KRW 679.2bn. PBR is around 0.16x and PER around 2.3x, and total liabilities stop at KRW 93.2bn. Nine-month cumulative operating profit in FY2026 was KRW 12.3bn, 38% above the prior year, and operating cash flow reached KRW 60.4bn in FY2025, the highest in five years. Dividends have been raised three years running. The starting point is the simple fact that a company with thick assets and little debt sits at these multiples.
Bear
In the most recent quarter (January–March 2026) operating profit swung to a loss of KRW 0.7bn and revenue fell from KRW 49.1bn a year earlier to KRW 38.4bn. Even on the nine-month cumulative basis, revenue growth of +0.7% is hard to call growth. More than half of profit comes from outside the core business, and with daily volume of only a few thousand shares it is hard to create an occasion for the price to normalise. Above all, this discount is not new — it has persisted for a long time. Without a trigger, the stock could stay cheap for several more years. (→ The value trap)
Our core scenario and its numerical threshold
Core scenario — does the net-net safety net hold? Can a company with net current assets at 3.6 times its market capitalisation and low debt also hold on to an operating profit in its core business and to a rising dividend? Thick assets alone are not enough; those assets must stop leaking and start flowing towards shareholders.
| Item | Detail |
|---|---|
| Threshold (clear this and the scenario is on track) | In the FY2026 annual report, a full-year operating profit maintained, and a year-end dividend per share held at KRW 200 or above |
| Disconfirmation (this and the scenario is off track) | A full-year operating loss in FY2026, or a cut in the dividend |
| Check date | September 2026, the FY2026 annual report plus the dividend disclosure |
There is a reason the threshold is set at “a full-year operating profit maintained”. The nine-month cumulative figure is already a profit of KRW 12.3bn, so unless the final quarter (April–June 2026) produces a loss larger than KRW 12.3bn, the full year ends in profit. But the immediately preceding quarter was KRW −0.7bn. Which way that final quarter tips is the real point of interest for this threshold, and the answer is all contained in a single September annual report.
What to watch next quarter
① FY2026 full-year operating profit — does the nine-month cumulative KRW 12.3bn survive the final quarter and close the year in profit? Whether the preceding quarter’s KRW −0.7bn was a one-off or a trend is decided here.
② The year-end dividend — is the KRW 200 per share held or increased? We are watching whether the three-year run of increases continues.
③ The composition of the KRW 470.0bn of current assets — how cash and cash equivalents and financial instruments are recorded in the notes to the annual report, and whether there is any trace of those assets moving towards affiliates.
All three will be confirmed at once in the September 2026 annual report. We will record the status in stock tracking, and even if the scenario goes off track we will leave that record in place rather than delete it.
Summary
Sewon Precision is a stock whose surface numbers catch the eye first. Market capitalisation KRW 105.9bn, net current assets KRW 376.8bn, PBR 0.16x, PER 2.3x. Debt is small, equity has risen all five years and the dividend has been raised three years running.
But a low multiple does not by itself become a return. This company’s assets are thick while the core business’s profit is thin, the most recent quarter was a loss, and the amount flowing from the storehouse to shareholders is still around 0.5% of net current assets. So rather than trying to call the price, we have set numerical thresholds — a full-year operating profit maintained and a KRW 200 dividend — and will update the status from the September annual report.
This piece does not recommend buying or selling any particular stock, and offers neither price targets nor trade timing. All figures are based on DART electronic disclosures and KRX data; the financials are from the FY2026 Q3 quarterly report (31 March 2026) and the annual reports for each fiscal year, and the share price is the closing price of 7 August 2026. For details, please see the disclaimer.
Update log
- 2026-08-15 — Each company covered here now has its own filing-traceable data page: price-to-book against total equity and against the owners’ share, five years of revenue, profit, equity and net cash, and the dividend, treasury and cancellation record — every figure beside the DART receipt it was read from. → Sewon Precision Industry (021820)
Get the next quarterly update for this company by email
When the next results are filed we send where this scenario stands. Nothing else.