Mastering Fundamental Analysis — A 10-Part Learning Roadmap
This article is both a table of contents and a study guide that threads together the ten instalments on fundamental analysis published by The Accidental Order. If you have just opened a set of financial statements for the first time, it can be hard to know where to start and in what order to read. This page shows at a glance what each article covers and why that sequence works, and it maps out a path you can follow at your own pace. Fundamental analysis has a single aim: to confirm, in numbers, whether a company genuinely earns money, and whether its price is cheap or expensive.
Why learn fundamental analysis
A share price moves up and down every day, but the price itself never tells you whether it is justified. The fact that a stock rose 10% in a day does not mean the company got that much better, nor that it got worse. To judge whether a price is justified you have to look at the business behind it — how much it earns, what it owns, how much it owes. Fundamental analysis is the discipline of checking that reality in an official document: the financial statements. Because it rests on disclosed figures rather than hunches or rumours, anyone can verify the same material — and that is its greatest strength.
The good thing about this discipline is that once you learn it, it lasts a lifetime. Fashionable themes come and go, but the skeleton of revenue, profit, assets, liabilities and cash flow does not change. Being able to ask the same questions of any company in any industry — that is the reason to learn fundamental analysis. The roadmap below organises those questions into four stages. Each stage is built on the understanding of the one before it, so following the order weaves scattered pieces of knowledge into a single system.
It is worth adding that fundamental analysis demands no special talent and no advanced mathematics. What it requires is the diligence to keep reading disclosure filings, and the caution to ask one more question when a number looks too good. In practice, most of the companies we analysed were quiet businesses without so much as a brokerage report, yet a great deal of their reality could be established from DART (Korea’s mandatory electronic disclosure system) filings alone, which anyone can access. The information asymmetry is smaller than you think, and the gap a diligent individual can close is larger than you think. The smaller the company — the ones institutions do not cover — the more it rewards an individual willing to spend the time digging. This roadmap is a guide to making that gap your own.
Stage 1 — Financial statement basics: how to read the numbers
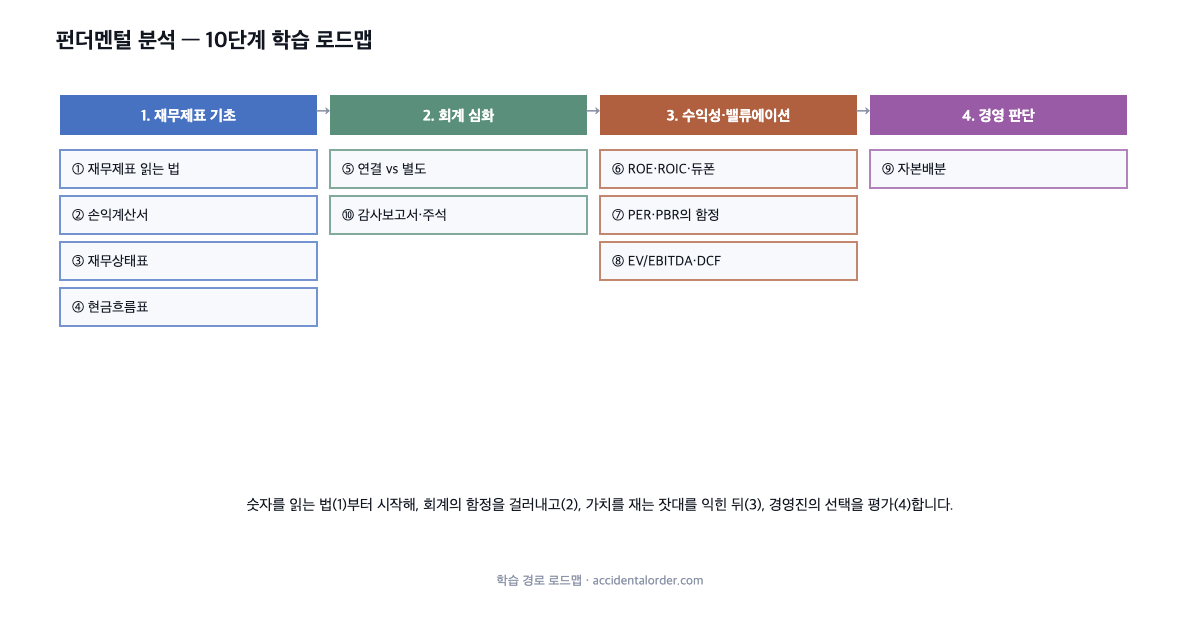
All analysis begins with the financial statements. Start with how to read financial statements, which covers what each of the three statements says and where to obtain them. Then the income statement shows how profit is left over from revenue down to net profit; the balance sheet shows the structure of what the company owns and what it must repay; and the cash flow statement teaches the difference between accounting profit and actual cash. These four articles are the basic grammar of fundamental analysis. Skip them and the ratios and valuation that follow become nothing more than memorised formulas. In particular, the three statements do not stand apart from one another — they are linked. Net profit from the income statement accumulates as retained earnings on the balance sheet, and whether that profit actually arrived as cash is confirmed by the cash flow statement. Training yourself to read the three documents together is the heart of Stage 1. By the end of this stage you will be able to open an unfamiliar company’s annual report and read for yourself the size and direction of its revenue, profit, assets, liabilities and cash.
Stage 2 — Deeper accounting: an eye for the traps
Once you have the basics, you learn where numbers are easily distorted or misunderstood. Consolidated vs separate financial statements deals with how the picture including subsidiaries differs from the picture of the parent alone. Just as revenue and equity differed sharply between the separate and consolidated statements in the Cuckoo Homesys case we analysed, which one you look at can change the conclusion. The audit report and the notes is about reading the assumptions and risks hidden behind the numbers. If the body of the financial statements is the conclusion, the notes are the evidence, and the audit opinion is an outside judgement on whether those numbers can be trusted. The information beginner investors most often miss is precisely what sits in those notes. Decisive clues — how revenue was recognised, whether there are contingent liabilities or litigation, what transactions took place with related parties — are hidden behind the headline figures. By the end of this stage you will be able to look one layer deeper and ask whether results that appear strong on the surface are genuinely solid, or an accounting illusion.
Stage 3 — Profitability and valuation: does it earn well, and is it cheap
Having confirmed the reality, you now assess quality. ROE, ROIC and the DuPont decomposition looks at how efficiently a company puts its capital to work, and breaks down whether that profitability comes from margin, turnover or leverage. Next, the traps in PER and PBR explains why the two most commonly used multiples cannot, on their own, prove that something is undervalued. Finally, EV/EBITDA and DCF covers enterprise value including debt, and the method of pricing a business by pulling future cash flows back to the present. These three articles give substance to any judgement that something is “cheap”. What matters in valuation is not finding a single right answer but narrowing the plausible range of value by cross-checking several yardsticks. A low PER may still look expensive on EV/EBITDA because of debt; conversely a high PBR may be justified by a high ROE. By the end of this stage you will be able to answer the question “is this price cheap or expensive” with several lines of evidence rather than a single indicator.
Stage 4 — Management judgement: how the money earned is spent
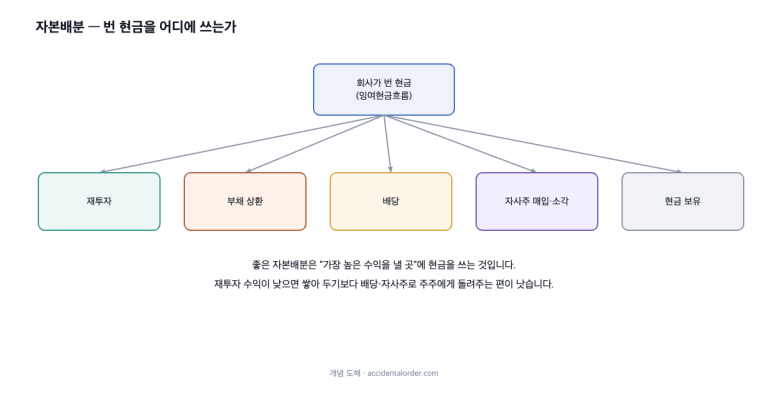
Finally, capital allocation is the lens for assessing where a company puts the cash it earns — reinvestment, dividends, buybacks or debt repayment — and how that choice affects shareholder value. A good business can leak value through poor capital allocation, while an ordinary business with excellent allocation can return a far larger share to its owners. The track record of capital allocation over many years reveals management’s real ability and its attitude towards shareholders. This is the stage where you read management’s judgement, beyond the numbers. The same KRW 10bn of profit produces entirely different long-term outcomes at a company that reinvests it into a growing business, a company that simply piles it up with no worthwhile use for it, and a company that returns it to shareholders through dividends and buybacks. By the end of this stage you will be able to make the qualitative judgement — is this management spending shareholders’ money well — that lies beyond the financial statements.
Common mistakes at each stage
Here are the points to watch as you follow the roadmap. In Stage 1, the common mistake is to look only at the bottom line of the income statement (net profit). Net profit can swing sharply on one-off items or accounting adjustments, so you need to read it alongside operating profit and cash flow before the quality of earnings becomes visible. In Stage 2, the frequent mistake is mixing consolidated and separate figures. Taking revenue from the consolidated statements while computing the debt ratio from the separate ones simply does not add up. You have to settle on one basis.
In Stage 3, the classic mistake is to conclude that something is undervalued merely because its PER or PBR is low. There is usually a reason for a low multiple, and you have to work out whether that reason is temporary or structural. Even a high ROE can be a warning sign if it comes from excessive debt. In Stage 4, be careful of assuming that a large dividend automatically means a shareholder-friendly company. If there are ample growth opportunities and the company raises dividends instead of reinvesting, that choice may in fact erode future value. Each article deals with these traps alongside real cases.
How to use this
Reading in order is best, but it is not compulsory. If financial statements are already familiar to you, start at Stage 3; and if you get stuck at a particular point while analysing a specific stock, jump straight to the article on that topic. That said, if you are learning for the first time, we recommend reading the four Stage 1 articles in order. Each article uses DART figures from listed companies we actually analysed — KT&G, Monami, Hansung, Muhak, Cuckoo Homesys and Osung Advanced Materials among them — as examples, so you can see how a concept applies in a real business. The moment an abstract formula meets a number inside a real listed company’s annual report is the moment the concept becomes a living tool. Learning from real companies rather than textbook illustrations is the approach this series aims for. Once you have learned the concepts, seeing them applied in our stock analysis will make the learning far more solid. In particular, we have published the whole process of taking apart overlooked stocks with no analyst coverage and applying each concept to them. These cases should help bridge the gap between textbook explanation and the messy numbers of a real company. The best revision of all is to pick one stock, open its annual report yourself, and ask the questions in the order this roadmap sets out.
The counterpart to fundamental analysis is technical analysis. If fundamentals measure value, technical analysis deals with the movement of the price at which that value is actually bought and sold. If you want to learn both branches together, see the final article of the technical analysis track to find out how the two tracks converge.
Three tips for studying on your own
First, apply a concept to real numbers as soon as you read it. Rather than memorising the ROE formula, find net profit and total equity in the annual report of a company you follow and divide them yourself — it will stay with you far longer. Keep the KT&G and Cuckoo Homesys examples from each article beside you, work through another company the same way, and the concept becomes second nature.
Second, do not try to understand everything perfectly in one pass. The financial statements are interlocked, so it is common for an earlier article to become clear only after you have read a later one. It is more efficient to skim the whole thing first to draw a broad map, then return to the relevant article when you get stuck analysing an actual stock. Learning is not a straight line but a spiral. The same concept is understood more deeply the second and third time you meet it.
Third, build the habit of doubting the numbers. The better results look, the more you should ask: “did this profit actually arrive as cash?”, “is it a one-off?”, “was it inflated with debt?” Stage 2, reading the audit report and the notes, is precisely the training that systematises that doubt. A good investor keeps a balance between optimism and scepticism. Too much optimism leads into traps; too much scepticism means missing good opportunities.
Finally, please remember that this roadmap exists not to recommend particular stocks but to build your own power of judgement. Instead of copying down someone else’s conclusion, reaching your own conclusion from the same public material — that is the kind of study The Accidental Order aims for. The purpose of this roadmap is not the conclusion but the process of building the muscle of judgement itself.
Key terms worth learning in advance
Before following the roadmap, here is a short summary of a few terms that will come up repeatedly. They may feel unfamiliar at first, but each article covers them in detail, so grasping the broad picture here is enough. Rather than trying to memorise each term perfectly, start by getting a feel for roughly what each one measures.
Revenue, operating profit and net profit are the three steps of the income statement. Revenue is the money that came in from sales, operating profit is what is left from the core business, and net profit is the final share after tax and interest. Assets, liabilities and equity are the skeleton of the balance sheet: assets are what you own, liabilities what you must repay, and equity the difference — the part that is genuinely yours. These three always balance as “assets = liabilities + equity”. Operating cash flow, unlike accounting profit, is the flow of cash actually in hand, and it is the yardstick for telling whether profit is real.
ROE is profit relative to shareholders’ equity — “how well was my money put to work”; PER is price relative to earnings — “how many times earnings is it trading at”; and PBR is price relative to equity — “how many times book value”. EV/EBITDA is a multiple that compares enterprise value, including debt, with operating cash-generating power, and DCF is the method of pricing a business by pulling the cash it will earn in the future back to present value. How these terms are used at each stage follows naturally from the concept map and from the individual articles.
Checking yourself after finishing
Once you have read all ten, test yourself on whether you can answer the following questions without hesitation. When I open an unfamiliar company’s annual report, can I establish for myself how much it earns (income statement), what it owns and how much it owes (balance sheet), and whether that profit actually arrives as cash (cash flow statement)? Can I distinguish whether this company’s profitability comes from margin, from turnover or from debt (the DuPont decomposition of ROE)? Can I explain whether the current price is cheap or expensive using several yardsticks rather than one? And finally, can I assess where this management spends the money it earns, and whether that serves shareholders?
If you can answer these questions in your own words, you already read companies more deeply than most individual investors. Being able to judge on your own evidence without being swayed by market noise is, over the long run, the most valuable asset in investing. If there are still points where you get stuck, go back to the article on that topic and read it again. Knowing which part is weak is itself considerable progress. Learning is never completed in one pass; it hardens through the round trip of applying it to a real company and returning to the concepts again. Do not rush — take it one stock at a time and make it your own.
Why this particular order
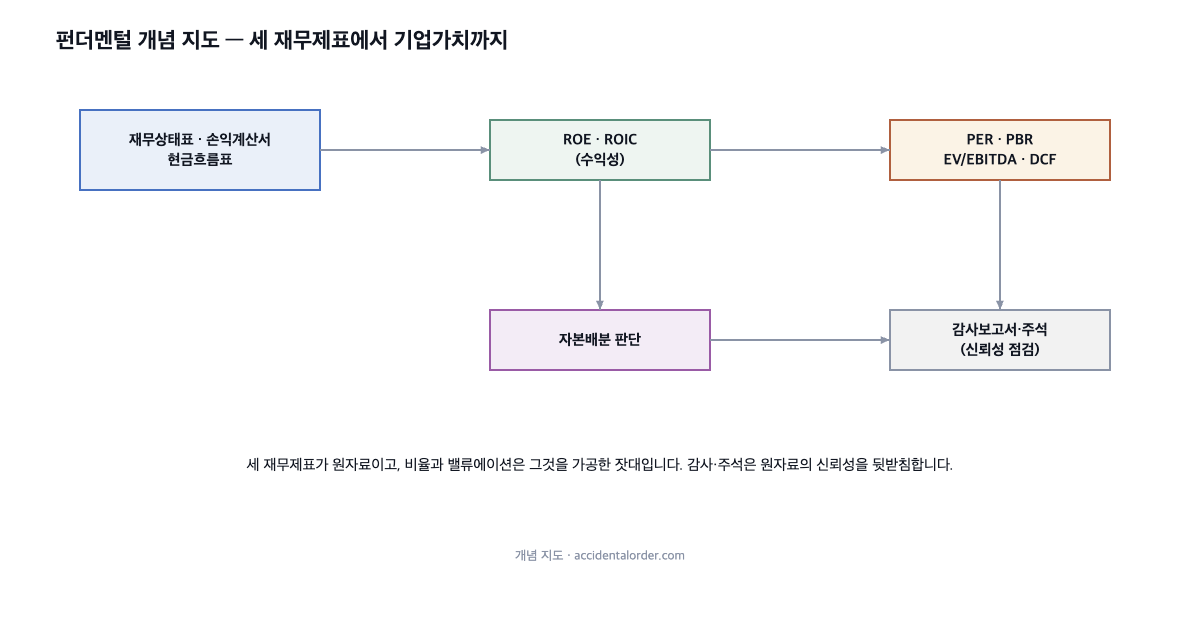
There is a reason for the order of the roadmap. You have to be able to read the raw material — the financial statements — before the ratios and valuations calculated on top of them can mean anything. PER, for instance, is price divided by earnings; without understanding from the income statement how those earnings were produced, you cannot interpret whether a PER is high or low. Likewise, if you cannot identify from the balance sheet what shareholders’ equity — the denominator of ROE — actually is, the DuPont decomposition is no more than plugging numbers into a formula. Building from the bottom up, from the concrete to the abstract, is the way to set concepts on firm ground.
It is also deliberate that the accounting traps (Stage 2) are placed before, or alongside, valuation (Stage 3). However precisely you value a company, if the numbers cannot be trusted the conclusion is a house built on sand. It is safer to check first whether the numbers can be believed and only then to price them. The same logic is why the audit and the notes are drawn in the concept map as the foundation supporting the reliability of the raw material.
Fundamentals are not everything
One balancing point is worth adding. Fundamental analysis is a powerful tool for measuring the value of a business, but it does not tell you when the market price will catch up with that value. Even if you buy an excellent company cheaply, the price may not move for some time if the market keeps ignoring it. So fundamentals tell you what to buy, while the questions of when and how much touch on supply and demand and liquidity — that is, the domain of technical analysis and market microstructure. Judgement is only complete when you hold both perspectives. In that sense this fundamentals roadmap is not the end but half of an investing education. It forms one picture when it meets the other half, technical analysis. If fundamentals speak to “what and why”, then technical analysis and an understanding of liquidity fill in “when, how much, and how to execute”. Relying on either alone tends to leave judgement at half strength.
Frequently asked questions
Q1. I know nothing about accounting — can I follow this?
Yes. Each article is written to start from an explanation for beginners and carry through to practical accuracy. If you read from Stage 1 in order, you can follow along without prior knowledge.
Q2. Do I have to keep to this order?
No. The roadmap is only a recommended path. You can skip to whichever topic you need, and each article is written to be understood on its own. That said, the concepts do depend on one another, so reading the four foundational articles first makes the rest easier.
Q3. How do I apply this to an actual stock?
Every article contains a case from a real listed company, so open the DART annual report of a company you follow and plug in the numbers the same way. Our stock analysis articles are examples that show that process from start to finish.
※ This article does not recommend the purchase or sale of any particular security; it is a study guide for educational purposes. Investment decisions and their consequences are the responsibility of the investor.