ROE and ROIC: Seeing Inside Profitability with the DuPont Breakdown
If you had to ask in a single number whether a company earns money well, many investors would point to ROE (return on equity). It measures “what percentage did the company earn in a year on the money shareholders entrusted to it?” Yet judging ROE on appearance alone is dangerous. Two companies can both post 15% and still be built quite differently underneath. This article opens up that inner structure through the DuPont breakdown, which splits ROE into three pieces, then carries on to ROE’s companion measure, ROIC, to train the eye that separates “good profitability” from “profitability that looks risky”.
To add one piece of the bigger picture: ROE and ROIC measure “how skilfully this company puts money to work”. A company is not good because its revenue is large or its profit rose; what tells you its true weight class is how much it earns relative to the capital it has put in. A company that steadily produces a large profit from a small capital base is a far better business than one that has to work a large capital base to produce the same profit. The former is effectively minting money efficiently from a modest stake. Once you hold this perspective, you look at “efficiency” before “scale” when you open a set of financial statements.
ROE — how much was earned on shareholders’ money
ROE is net profit divided by shareholders’ equity (total equity). Since shareholders’ equity is the net assets belonging to shareholders, ROE shows, as a percentage, “how much the company earned in a year against the money shareholders have left in it”. An ROE of 10% means the company earned 10 won in a year on 100 won of shareholders’ money, and if that pace holds, shareholders’ capital roughly doubles every seven years.
An ROE that is high and steady is generally the mark of a good company. Sustaining a high ROE over many years in particular means that even the profits ploughed back into the business go on earning a high return, so the force of compounding works powerfully. That is why long-term investors set store by ROE. Before taking the equation “high ROE = good company” at face value, however, you must always break down how that ROE was produced. This is where the DuPont breakdown comes in.
The DuPont breakdown — ROE in three pieces
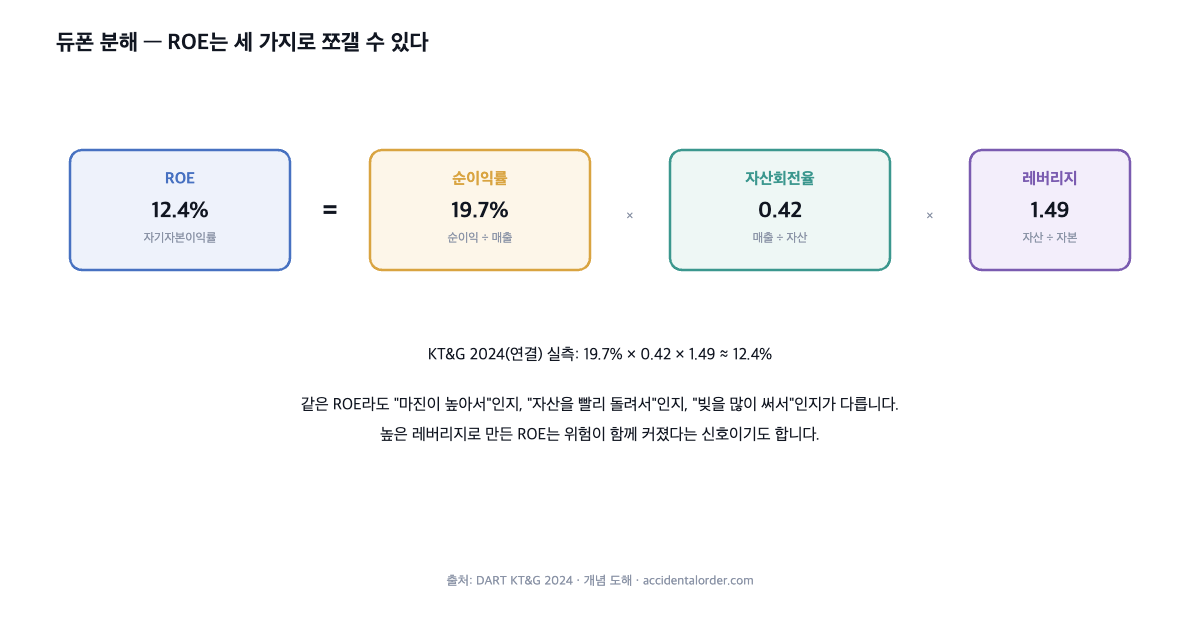
DuPont analysis splits ROE into the product of three factors: ROE = net margin × asset turnover × financial leverage. Each is calculated as follows. Net margin is net profit ÷ revenue (the margin), asset turnover is revenue ÷ assets (how quickly assets are cycled), and financial leverage is assets ÷ equity (how much debt has been used).
This breakdown is powerful because it reveals “what the ROE was made of” even when the ROE itself is identical. Take KT&G in the diagram above: its 2024 ROE of 12.4% is a combination of a high net margin (19.7%), low asset turnover (0.42) and moderate leverage (1.49). As befits a tobacco and health-functional-products business, margins are thick but assets are not cycled quickly. At the other extreme, a retailer may run thin margins yet cycle assets rapidly to arrive at the same ROE. Split into three pieces, the character of the business shows up in the numbers.
The leverage trap — the shadow behind a high ROE
The DuPont breakdown matters especially because of the third factor, financial leverage. That figure, assets ÷ equity, rises the more debt a company uses. And as leverage rises, so does ROE. In other words, you can lift ROE simply by taking on more debt. The ROE number climbs even though the underlying business has not improved at all.
So when you see a high ROE, you have to ask: “did this come from margin or efficiency, or did it come from debt?” An ROE inflated by leverage looks dazzling in good times, but in bad times that debt bears down on the company. It is the same point as the emphasis on the debt-to-equity ratio in the earlier article on the balance sheet. The DuPont breakdown exposes the leverage risk hidden behind a glamorous ROE. That is why a high ROE should not be welcomed unconditionally without first checking its composition.
The measurements — ROE across our stocks
Comparing the 2024 ROE (consolidated, net profit ÷ total equity) of the companies we have analysed brings out the differences in profitability.
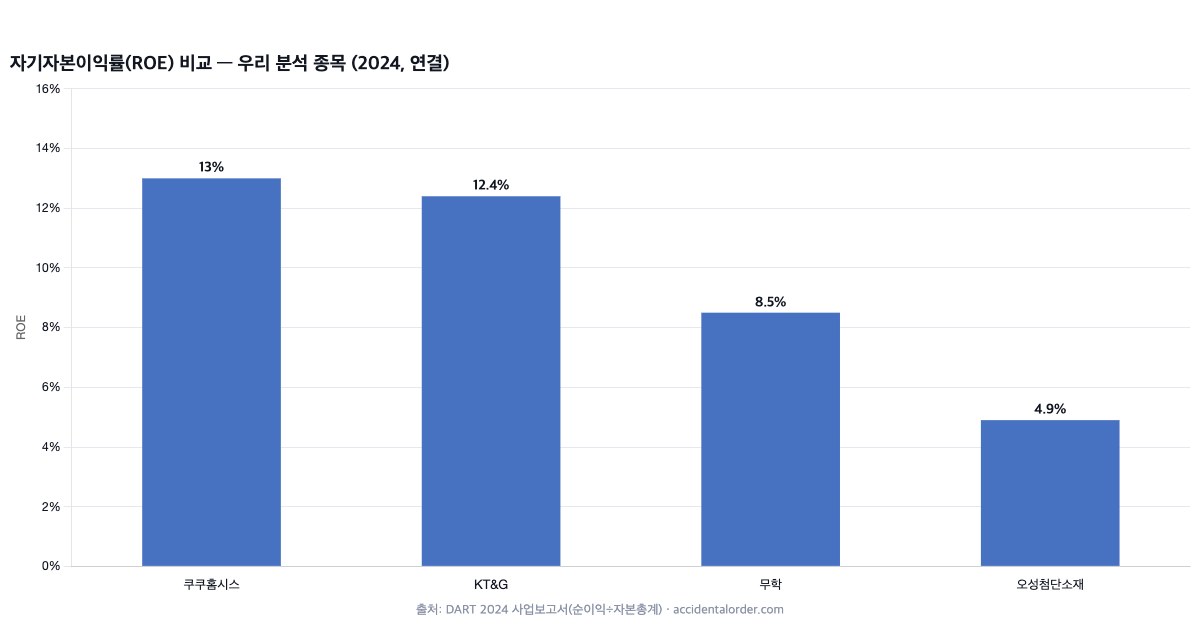
Cuckoo Homesys (13.0%) and KT&G (12.4%) sit at a similarly high level, Muhak (8.5%) is in the middle, and Osung Advanced Materials (4.9%) is low. Yet even at a similar 13% level, Cuckoo Homesys builds its ROE on recurring rental revenue while KT&G builds it on the high margins of tobacco, so the two are different in character. Muhak’s low ROE reflects the fact that operating earnings are not large while its equity (net assets) is thick — and Muhak’s investment case never rested on profitability but on asset value. Osung’s low ROE means its profit is still small relative to its capital, and it will improve only if the sharp rise in 2024 earnings continues. As these cases show, ROE is complete in meaning only when the absolute value is read together with “why is it that value?”
ROIC — the true profitability, debt included
ROE’s weakness is that it is swayed by leverage. The measure that corrects for this is ROIC (return on invested capital). ROIC looks at how much is earned not on shareholders’ money alone but on the entire capital invested, debt included. Roughly, it is net operating profit after tax (NOPAT) divided by invested capital (shareholders’ equity + net borrowings). Because the inflating effect of debt is stripped out, it comes closer to the true profitability of the business itself.
ROIC’s real usefulness emerges when it is compared with the cost of capital (WACC). If ROIC exceeds the cost the company incurs to raise funds (WACC), the company is creating more value than the capital it has put in. Conversely, if ROIC falls below WACC, the more the business is worked the more value it destroys. That is why “ROIC > cost of capital” is counted among the essential conditions of a good company. If ROE is “profitability from the shareholder’s viewpoint”, ROIC is the stricter yardstick measuring “the profitability of the business itself”.
Reading ROE and ROIC together
Set side by side, the two make the character of a company sharper still. If ROE is high while ROIC is ordinary, that is a signal that much of the high ROE came from leverage — from debt. If, on the other hand, ROE and ROIC are both high and close to each other, the company is likely a healthy one earning a high return from the business itself rather than leaning on debt. A company with almost no debt (like Muhak) produces an ROE and an ROIC that are close together. The gap between the two measures is itself a statement about how the company manufactures its profitability.
Sustainability — will high profitability hold?
Finally, the most important question when looking at ROE and ROIC is “can this profitability be sustained?” High profitability invites competition. When other companies pile into the market, margins are shaved and profitability comes down. So a company that holds a high ROIC for a long time usually has something others cannot easily encroach on — a strong brand, economies of scale, switching costs, patents and the like. This is what is commonly called a “moat”.
Rather than getting excited about one year of high ROE, then, the crux is to ask “has this profitability held for at least three to five years, and is there a reason for it to hold from here?” An ROE that spikes on a one-off soon reverses, while a structurally high ROE endures. What determines investment value is not the fact that a company posted a 20% ROE last year but how many more years that 20% can be sustained. This distinction is the final gate through which any profitability measure must pass.
The three routes to a higher ROE
The DuPont breakdown shows that a company has only three ways to raise ROE. First, raising the margin (net margin). This means keeping more profit from the same revenue, and it comes from pricing power or cost control. It is the healthiest route. Second, cycling assets faster (asset turnover). This means generating more revenue from the same assets, and it is a question of efficiency. Third, taking on more debt (leverage). As we have seen, this route lifts ROE but enlarges risk along with it.
So if ROE has improved, you need to see “which of the three improved”. An ROE that rose because margin or efficiency got better is worth welcoming, but an ROE that rose because debt was increased is closer to a warning sign. Lay several years of DuPont breakdowns side by side and this pattern becomes visible. In a company where margin and efficiency are unchanged while leverage keeps climbing and ROE rises with it, risk may be accumulating behind the glamorous profitability.
Share buybacks and ROE
When a company buys back its own shares and cancels them, ROE goes up, because shareholders’ equity — the denominator — shrinks. Even with profit unchanged, a smaller capital base to divide it across raises the return on capital. That is why companies active in returning capital to shareholders often use share cancellation to lift ROE and per-share value together.
This too has two sides. Reducing equity through buybacks has the effect of increasing financial leverage, so taken too far it can damage financial stability. An ROE lifted by buybacks therefore also has to be sorted into “is the underlying business profitable as well, or has the number simply been manufactured by shrinking the capital base?” Healthy shareholder returns and cosmetic accounting are not the same thing. Making that judgement also requires the cash flow statement covered earlier — because you need to see whether the return was funded out of genuine surplus cash (free cash flow).
ROIC in a little more detail
ROIC is simple in concept but needs a little tidying up in the calculation. The numerator is net operating profit after tax (NOPAT), obtained by multiplying operating profit by (1 − the corporate tax rate). The key point is that it starts from operating profit rather than net profit, in order to strip out the effect of interest expense. The denominator, invested capital, is the capital actually committed to the business, obtained roughly by adding net borrowings (borrowings − cash and cash equivalents) to shareholders’ equity.
Calculated this way, the profitability of the business itself can be compared whether a company uses a lot of debt or a little. A company that has inflated its ROE with debt has its bare face exposed when viewed through ROIC. The calculation is somewhat fiddly, but ROIC is the measure that answers most directly the fundamental question “how efficiently does this company put capital to work?” It is also why many value investors, Warren Buffett among them, weigh ROIC (or return on tangible capital) more heavily than ROE.
Margin and turnover — the fingerprint of an industry
DuPont’s first two factors, net margin and asset turnover, reveal the character of an industry like a fingerprint. Some industries — luxury goods, software, pharmaceuticals — carry high margins but cycle assets slowly, while others, such as hypermarkets and retail, run thin margins yet pile up profit by cycling assets quickly. KT&G, seen above, is a classic case of the former: high margin, low turnover.
Net margin and asset turnover therefore must not be compared across industries; they carry meaning only within the same industry. The point is not “low margin, so a bad company” but whether the company’s margin is lower or its turnover slower than its peers in that industry. In this way the DuPont breakdown lets you pit a company precisely against its own competitors. A business structure that is missed when you look only at the single result called ROE becomes clear once it is divided into three.
The ROE illusion — when the capital base is thin
ROE grows as its denominator, shareholders’ equity, shrinks, and this sometimes creates an illusion. A company whose capital has been heavily eroded by accumulated losses can post an abnormally high ROE on even a small profit. In the extreme, for a company close to capital impairment the ROE figure becomes meaningless. So when an ROE is unusually high, you have to check “is the profit genuinely large, or is the capital base unusually thin?”
Conversely, a company with very thick equity (net assets), like Muhak, will show a low ROE even when earnings from the core business are not bad. In that case a low ROE may mean “a lot of assets have piled up” rather than “profitability is poor”. Judging a company on ROE alone misses this context. ROE is interpreted properly only when read together with the capital structure on the balance sheet.
Profitability and reinvestment — the engine of compounding
The real reason a high ROE or ROIC is treated with such respect in long-term investing lies in reinvestment. A company does not pay out everything it earns as dividends but puts it back into the business, and if that reinvestment again turns at a high rate of return, a virtuous circle is created in which profit begets profit. This is compounding at work inside the company.
A company “that sustains a high ROIC and has ample room to reinvest its profits” can therefore see its value snowball as time passes. Conversely, when a company whose ROIC sits below its cost of capital increases reinvestment, the more it reinvests the more value it destroys. “Does this company have somewhere to reinvest, and is the return on that reinvestment high?” is thus the terminus of profitability analysis and one of the most important questions in long-term investing.
A caution when measuring ROE on a consolidated basis
When ROE is calculated on a consolidated basis, the distinction between consolidated and separate statements covered earlier applies in full. Strictly, both net profit and shareholders’ equity should be aligned to the portion “attributable to owners of the parent”. Dividing total consolidated net profit by controlling-interest equity, or conversely dividing controlling-shareholder net profit by total equity (including non-controlling interests), misaligns the basis of numerator and denominator and distorts the result.
The larger a company’s non-controlling interests, the greater the impact of this error. In a group where the minority shareholders of subsidiaries hold a substantial share, for instance, mixing the two bases moves ROE quite far from reality. Hence the need for the habit of checking, in practice, “which net profit has this ROE been divided by which capital?” We too once mis-aggregated total equity while analysing a company and skewed a measure, and we corrected it as soon as it was confirmed and left a record of that history. Profitability measures may look simple to calculate, but accuracy is decided by aligning the basis of the numerator and the denominator.
Average equity or period-end equity?
To add one practical detail: the value of ROE differs slightly depending on whether period-end shareholders’ equity or the average of opening and closing equity is used as the denominator. If equity changed substantially during the year through a rights issue or a large dividend or buyback, using period-end equity alone can introduce distortion, so average equity is more accurate. In most cases the difference is small, but in a year of large capital movements it is worth being conscious of it. Using a measure while knowing its definition is not the same as copying down a number.
Frequently asked questions (FAQ)
Q1. What level of ROE counts as good?
It depends on the industry and the interest-rate environment, but a company that consistently delivers 10–15% or more over the long run is commonly regarded as high quality. More important than the absolute value, though, are “whether that ROE came from margin and efficiency or from leverage” and “whether it holds across several years”.
Q2. ROE is high, so why isn’t the share price rising?
Even with a high ROE, if the market has already priced that profitability in (a high PBR), the room for further gains may be limited. Conversely, if ROE is improving and the market has not yet reflected it, that may be an opportunity. ROE is only a profitability measure; it has to be read alongside valuation (PER and PBR).
Q3. Which matters more, ROE or ROIC?
They serve different purposes. ROE is profitability from the shareholder’s viewpoint; ROIC is the profitability of the business itself. The more debt a company uses, the wider the gap between the two, so they should be read together — and above all, whether ROIC exceeds the cost of capital is the crux of value creation.
A checklist for reading profitability measures
- The level and trend of ROE (3–5 years): is it high and steady?
- The DuPont breakdown: which of margin, efficiency or leverage produced the ROE?
- Watch the leverage: was the ROE made simply by adding debt?
- ROIC vs the cost of capital: does the business earn more than its cost of capital?
- Sustainability (the moat): is there a reason for this profitability to hold?
Summing up
ROE measures profitability against shareholders’ money, and breaking it apart with DuPont reveals whether it came from margin, efficiency or leverage. An ROE inflated with debt has enlarged risk alongside it and warrants caution. ROIC measures the profitability of the business itself, debt included, and true value is created when it exceeds the cost of capital. And for any profitability measure, the last question is “is it sustainable?” The next article takes the profitability and asset value judged in this way and sets them against the price the market has attached, through PER and PBR. We will look at why the two measures are useful, and why a simple reading such as “the PER is low, so it is cheap” so often turns into a trap, with measurements alongside.
Investment study · fundamental analysis. This article is provided for information purposes and is not a recommendation to buy or sell any particular stock. Figures are based on the original DART disclosure filings and may change after the time of writing (July 2026).