SK Hynix (000660): a 12x rally and the first week of the listing — what to watch
Update 2026-08-08 — Q2 results in · the scenario baseline is fixed
Provisional second-quarter results were released on 29 July 2026. The original text below is left as it was; the confirmed figures and the baseline for the scenario are added here.
| Item (consolidated) | Q2 2026 | Year on year |
|---|---|---|
| Revenue | KRW 79.32tn | +256.8% |
| Operating profit | KRW 60.54tn | +557.2% |
| Net profit attributable to controlling interests | KRW 93.82tn | +1,240.8% |
| Q2 operating margin | 76.3% | — |
Watch point A — defending the margin
The operating margin for the first half of 2026 was 74.4% (operating profit of KRW 98.15tn ÷ revenue of KRW 131.90tn). That is the opposite pole from the 2023 trough of −23.6%, which this article marked as the line not to go back to. Watch point A is met.
The baseline for the core scenario is now fixed
The core scenario in this article was that “cumulative EPS and free cash flow per share over the four quarters after the capital raise do not fall below the four quarters immediately before it”. Because the disclosure of the results of the rights issue came on 15 July 2026, “the four quarters after the raise” are counted from Q3 2026, and this second quarter is in fact the final piece of the comparison period, the four quarters immediately before the raise. So these results have fixed, in numbers, the line that has to be cleared.
| Baseline calculation (net profit attributable to controlling interests) | Amount |
|---|---|
| Full-year 2025 | KRW 42.92tn |
| H1 2025 | KRW 15.10tn |
| = H2 2025 (Q3 and Q4 2025) | KRW 27.81tn |
| + H1 2026 (Q1 and Q2 2026) | KRW 134.15tn |
| Cumulative over the four quarters before the raise (Q3 2025–Q2 2026) | KRW 161.97tn |
| ÷ post-issue share count of 730,492,365 = baseline EPS | KRW 221,721 |
From Q3 2026 onwards, if cumulative net profit attributable to controlling interests over four quarters exceeds KRW 161.97tn (KRW 221,721 per share), the scenario stays on track; if it falls short, it is recorded as off track. For reference, this second quarter alone added KRW 128,434 per share on the post-issue share count.
Meanwhile the share price has fallen a long way from its peak since this article was written (closing price of KRW 1,422,000 on 7 August, −19.4% from 20 July; source: KRX). But status on this site is tracked by the numbers above, not by the share price. Even if the price falls, the scenario is on track as long as the baseline is being cleared. The next update is the third-quarter results — the first quarter after the raise.
※ Prices and market capitalisation as of 2026-07-13 (a phase with daily swings of ±15% — this will be refreshed to the previous close at the time of publication).
The Accidental Order has so far mostly covered overlooked stocks that brokerage research does not reach. This time it is an experiment in applying the same method to the opposite end of the spectrum, the most heavily covered stock of all, SK Hynix. Instead of guessing a price or pointing to a moment to trade, we set out this stock’s core scenario and watch points and update them each time quarterly results come out. It is doing exactly what we do with overlooked small caps (→ Overlooked stocks and charts) on a stock that everybody is watching.
How the money is made — DRAM, and HBM
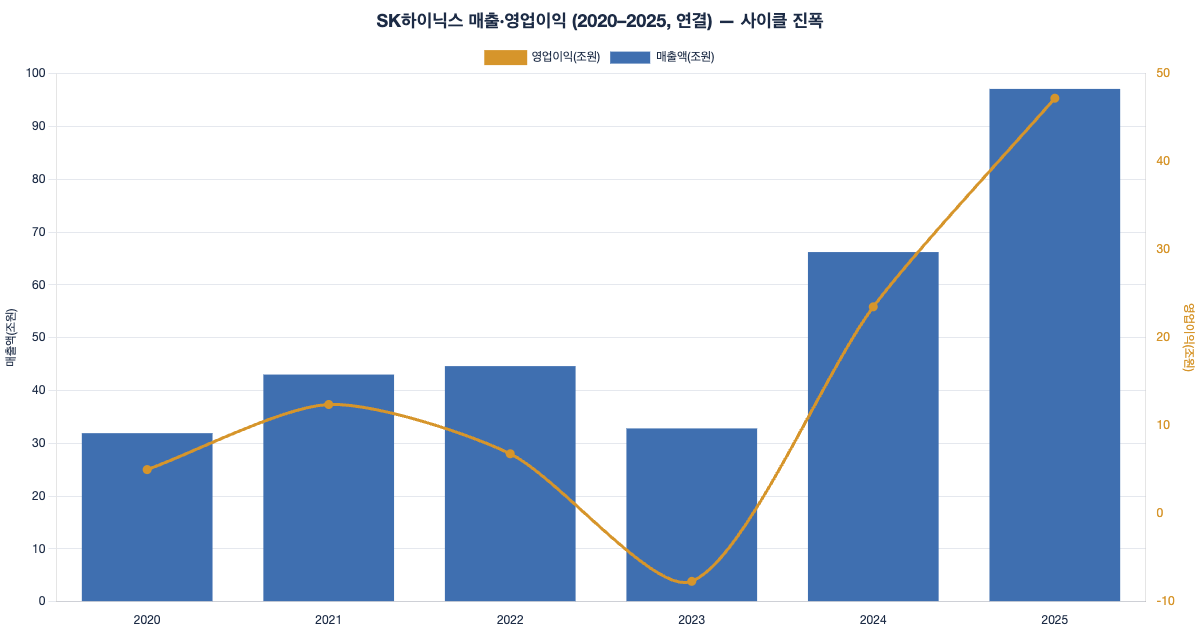
SK Hynix’s revenue splits broadly into DRAM and NAND Flash. On a 2025 consolidated basis DRAM accounted for KRW 74.9tn, or 77.1% of the total, and NAND for KRW 20.7tn, or 21.3%. Since DRAM was 67.6% of the mix in 2024, the tilt towards DRAM grew by about 9.5 percentage points in a single year. Inside that DRAM figure sits HBM, the high-bandwidth memory used in AI accelerators. In the filings HBM is included within DRAM and no separate amount is broken out, but the company states that it was the first in the world to mass-produce HBM3E, in March 2024.
The regional concentration is even starker. In 2025, 68.8% of revenue came from the United States (KRW 66.9tn). China follows at 19.7%. The numbers lay bare a structure in which HBM demand from US customers, where AI data-centre investment is concentrated, has driven the results.
Reading the cycle — five years of financials and valuation
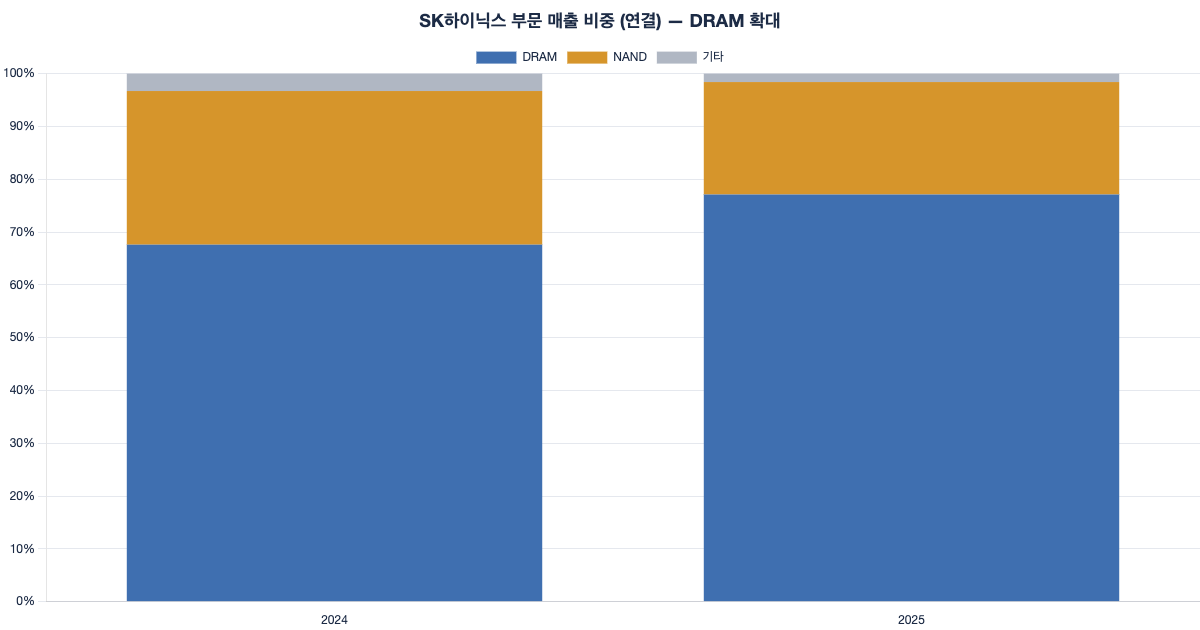
Memory is a cyclical industry. Operating profit fell from KRW 6.8tn in 2022 to a loss of KRW 7.7tn in 2023, then leapt to KRW 23.5tn in 2024 and KRW 47.2tn in 2025. That is a swing of KRW 31tn within a single year. Net profit traced the same path, from −KRW 9.1tn in 2023 to KRW 42.9tn in 2025.
| Consolidated (KRW tn) | 2021 | 2022 | 2023 | 2024 | 2025 |
|---|---|---|---|---|---|
| Revenue | 43.0 | 44.6 | 32.8 | 66.2 | 97.1 |
| Operating profit | 12.4 | 6.8 | −7.7 | 23.5 | 47.2 |
| Net profit | 9.6 | 2.2 | −9.1 | 19.8 | 42.9 |
| Operating margin | 28.9% | 15.3% | −23.6% | 35.5% | 48.6% |
Valuation has to state its basis clearly to avoid misunderstanding. As of 2026-07-13 market capitalisation was about KRW 1,314.94tn, and the PER of 17.47 shown by Google Finance is on trailing twelve-month (TTM) earnings. Calculated on 2025 full-year net profit alone (KRW 42.9tn), by contrast, the PER works out at about 31x. The gap between the two numbers implies that earnings surged during 2026 — and indeed first-quarter 2026 operating profit alone was KRW 37.6tn (on revenue of KRW 52.6tn), close to the whole of 2025’s operating profit (KRW 47.2tn). PBR is about 10.9x (market capitalisation ÷ 2025 equity of KRW 120.7tn).
What happened in the first week of the listing — data only
As this is written, SK Hynix is in the middle of a very large event. We set out the facts alone, without asserting causation.
- Nasdaq ADR listing. About 177.9 million ADRs were offered at USD 149 each, raising about USD 26.5bn (about KRW 40tn). It was reported as the largest US IPO ever by a foreign company. The first day closed at USD 168.01 (+12.76%), having traded as high as USD 177 intraday.
- Final terms of the share issue (from the DART filing). The structure was a third-party allotment to an overseas depositary, with a new share issue price of KRW 2,249,751 — a 2.72% premium to the reference price (KRW 2,190,229), not a discount. Proceeds were about KRW 40.02tn. Adding about 17.79 million new shares to the 712,702,365 shares outstanding before the issue takes the post-issue count to about 730.49 million — dilution of only about 2.5%.
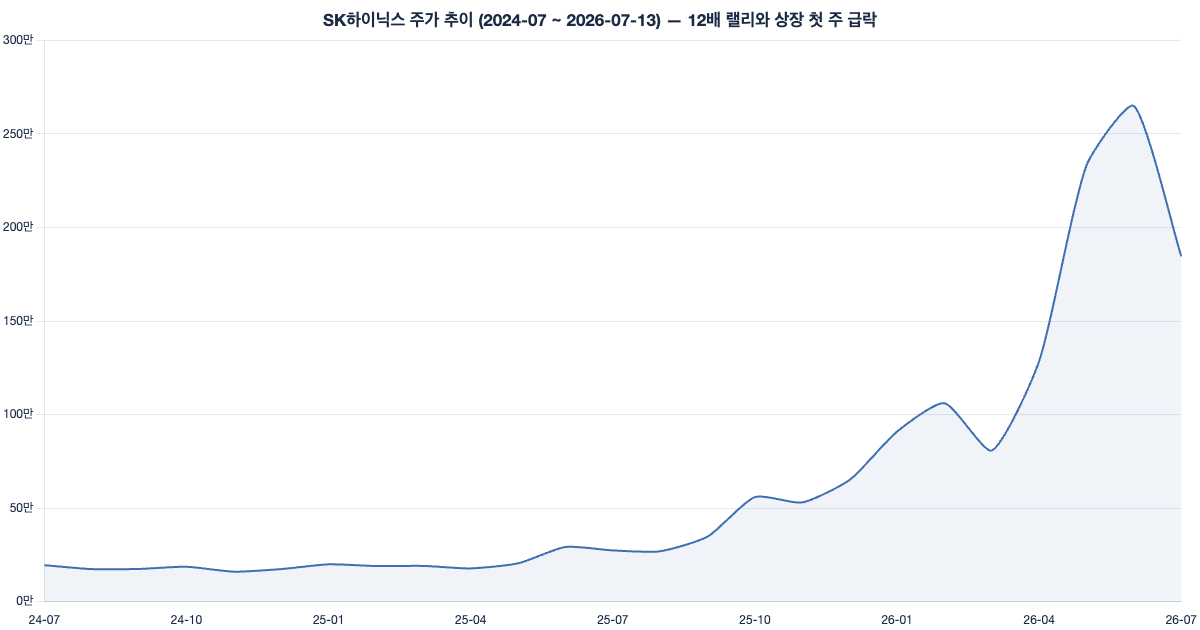
- The ordinary shares fell sharply. On 13 July, when regular trading resumed, SK Hynix on the KOSPI (Korea’s main board) closed at KRW 1,845,000, down 15.37% (reported intraday at −12.75%). The reported background was profit-taking after the ADR listing and caution ahead of the second-quarter results.
The core scenario — does the KRW 40tn come back as profit?
First, one common misconception to clear away. Some see this KRW 40tn raise as “massive dilution”, but that is not what the facts say. The share count rose by only about 2.5%, and the new shares were issued at a 2.72% premium to the reference price. The damage to per-share value is therefore limited. The real tension in this stock is not dilution but whether the KRW 40tn raised comes back as profit. So the core scenario we set is this.
Despite the larger share count from the rights issue and the ADR listing (about 730.49 million shares after the issue), cumulative EPS and free cash flow per share over the four quarters after the raise do not fall below the four quarters immediately before it.
Per-share figures are always calculated using the post-issue share count (about 730,492,365 shares) as the denominator. The circumstances in which this scenario goes off track are clear — if cumulative earnings per share or free cash flow per share over the four quarters after the raise come in below the level immediately before it, or if the KRW 40tn raised does not translate into higher results. In that case we record in stock tracking that this article’s scenario went astray.
Alongside the main scenario there are two dials to watch. These are supporting watch points to be checked every quarter, starting with the second-quarter results in late July.
- Watch point A — defending the margin. As long as the DRAM share stays at or above 75%, does the half-year operating margin avoid returning to the past trough (−23.6% in 2023) and hold double digits (≥10%)? A margin falling into single digits, or a DRAM share retreating below 70%, is the alarm.
- Watch point B — free cash flow stays positive. Even with annual capex above KRW 25tn, does operating cash flow exceed it so that free cash flow (OCF − capex) stays positive? It was negative in 2022 and 2023 and turned positive in 2024 and 2025.
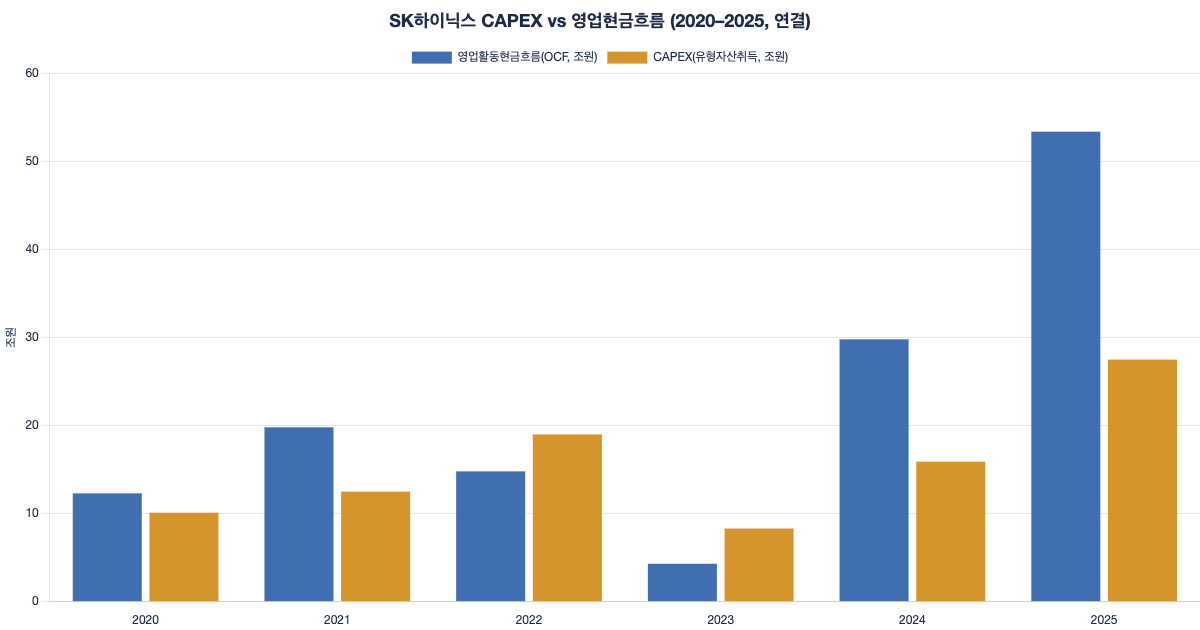
The bull case
The backbone of the bull case is earnings power and the nature of the raise. An operating margin of 48.6% in 2025 and operating profit of KRW 37.6tn in the first quarter of 2026 are exceptionally high even by the standards of memory’s history, and with HBM leading, the DRAM mix has improved and the quality of profit with it. This raise came at a premium with dilution of about 2.5%, so the burden on shareholders is small, while the KRW 40tn secured is ammunition to be put into expanding AI memory capacity (M15X in Cheongju and others). Free cash flow has also been positive in 2024 and 2025 in a row. If the money raised comes back as profit in the next cycle, this issue becomes not dilution but the funding for growth investment.
The bear case
The heart of the bear case is valuation, the cycle, and the volatility just experienced. First, the share price has risen about 12 times in 52 weeks and PBR is about 10.9x, a historically expensive zone. A large part of a 12-fold rally is future HBM demand priced in ahead of time, so there is a risk that expectations have run ahead of results. Second, a debate over the sustainability of AI investment (the so-called “AI bubble”) is under way in the market. If the pace of AI data-centre investment slows, HBM demand and prices could turn down together. Third, memory is a cyclical industry — this is the very company that posted a loss of KRW 7.7tn in 2023, and when supply grows and demand cools, another downturn arrives. Fourth, the fact that the shares fell more than 15% in the first week of the listing itself shows that this stock is in a high-volatility phase, easily shaken by events and by flows. If watch points A and B break down, the premises of the bull case are shaken with them.
What to watch next quarter
There are three things to look for in the second-quarter results in late July. ① Whether per-share figures (EPS and free cash flow per share) on the post-issue share count (about 730.49 million shares) hold up against the level immediately before the raise. ② Whether the operating margin holds double digits and the DRAM share stays at or above 75%. ③ Whether free cash flow is positive. These are the core variables of this stock’s scenario. When the results come out we will update this article and stock tracking.
Flow data (trading by pension funds, foreign investors and institutions) is not covered in this article and will be added in a later update.
The deeper concepts are covered in the educational articles. The quality of funding and cash flow continues in How to read the cash flow statement, and enterprise valuation including debt in EV/EBITDA and DCF.
This article is for information purposes and is not a recommendation to buy or sell any particular stock. Figures are cited from DART, KRX/FDR and press reports together with their sources, and may differ after the time of writing (July 2026).
Update log
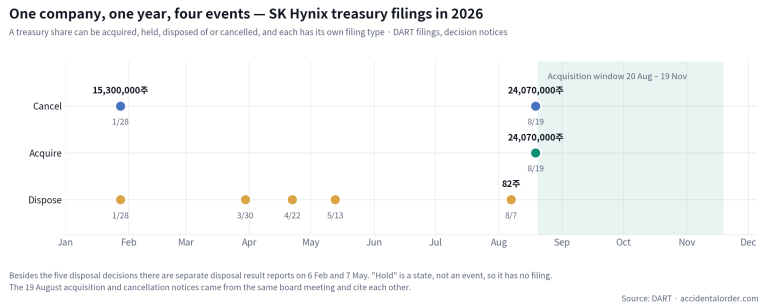
- 2026-08-15 — Each company covered here now has its own filing-traceable data page: price-to-book against total equity and against the owners’ share, five years of revenue, profit, equity and net cash, and the dividend, treasury and cancellation record — every figure beside the DART receipt it was read from. → SK Hynix (000660)
Get the next quarterly update for this company by email
When the next results are filed we send where this scenario stands. Nothing else.