Earnings Season Preview — Nine Tracked Companies and What to Watch in July and August
📈 Series: Company Analysis — this article serves as the update hub for the tracked companies (the list grows as analyses are published) through the July–August earnings season.
Earnings season is opening. The starting gun is SK Hynix’s second-quarter results on 29 July, and by mid-August listed companies file their half-year reports (banyeon bogoseo, due within 45 days of the H1 close) all at once — the statutory deadline is 14 August, and last year the tracked companies filed on 13–14 August. The Accidental Order has analysed nine companies so far and placed them on the tracking ledger. Each article carries a numerical statement of “what to check next quarter” — this season brings the first update to all of them.
This article is the cover sheet for that status table. It gathers the watch points for all nine companies into a single table and lays out the filing calendar based on the measured disclosure dates from last year. As results come in, I will update each analysis and the tracking ledger, and reflect the outcomes here as well.
Why earnings season is the test bench
The Accidental Order’s analyses are written as verifiable propositions, not forecasts. Not “this company is good,” but “here is the proposition I have set out about this company, and if next quarter’s numbers clear this threshold it stands, and if they do not it is rejected” — written down in advance. Thresholds are not moved after the fact. That makes July and August, when quarterly results and half-year reports arrive, the period that shows whether the method actually works.
The assessment rules are the same as on the tracking ledger. Meet the previous watch point and it is 🟢 (scenario on track); have the core proposition falsified by results or a disclosure and it is 🔴 (scenario off track); if the data is not in yet or the signals are mixed, ⚪ (pending). Even when 🔴 comes up the row is not deleted — it is preserved permanently along with the reason, because a record of the misses is what gives the record of the hits any meaning.
Nine tracked companies × what to watch this season
| Company | Core scenario | Numbers to check this season | When |
|---|---|---|---|
| SK Hynix (000660) | Roughly KRW 40tn raised (rights issue and ADR) is absorbed without damaging shareholder value | EPS and FCF per share on the post-issue share count (approx. 730m shares), double-digit operating margin, DRAM share of 75%+ | 29 Jul Q2 results → August half-year report |
| Whanin Pharmaceutical (016580) | ① Earnings normalisation ② expanded shareholder returns after the succession | H1 cumulative operating profit of KRW 14.0bn+ (Q2 alone KRW 4.6bn+), H1 revenue of KRW 140bn+ / falsified if: Q2 operating profit below KRW 3.0bn | Preliminary disclosure (1 Aug last year) → half-year report |
| SCD (042110) | Net cash > market cap, plus continued dividend increases | H1 operating profit stays positive, cash and equivalents KRW 70bn+ and debt-free status maintained / falsified if: successive sharp earnings declines put it on a path to an operating loss | August half-year report (14 Aug last year) |
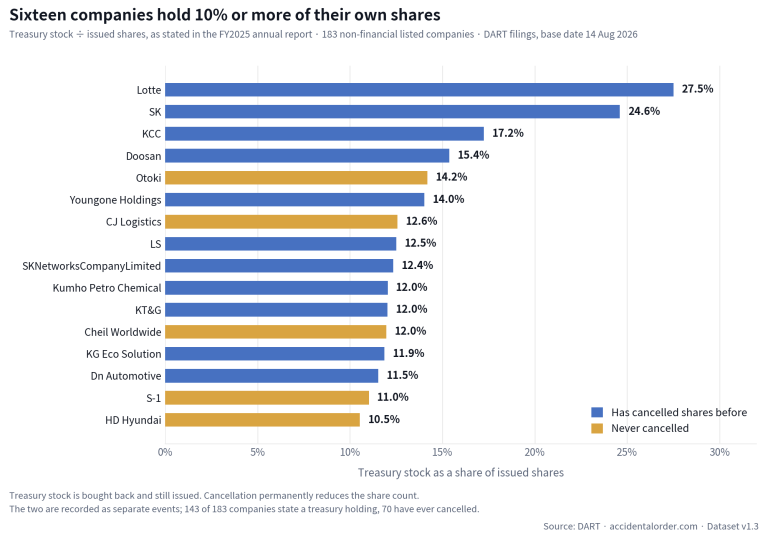
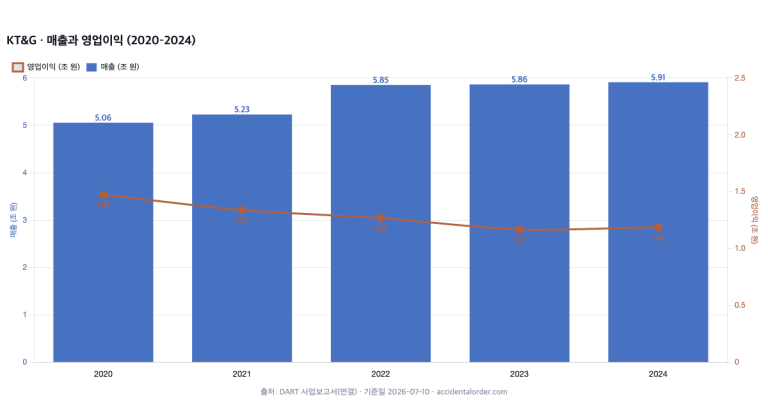
| KT&G (033780) | Overseas cigarette revenue keeps growing at 20%-plus | Q2 overseas cigarette revenue growth rate | Preliminary disclosure (7 Aug last year) → half-year report |
| Muhak (033920) | Core operating profit maintained + net cash transferred to shareholders | Q2 operating profit, dividend and buyback signals | August half-year report |
| Cuckoo Homesys (284740) | Rental-based operating profit of KRW 140bn+ maintained and growing | H1 operating profit pace (annualising to KRW 140bn), overseas rental accounts including Malaysia | August half-year report |
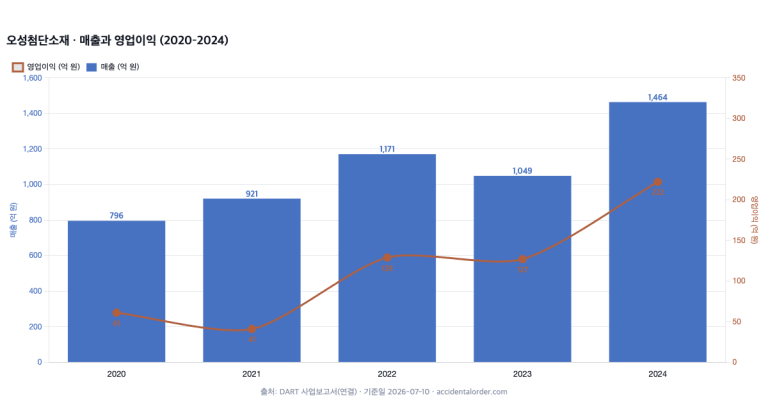
| Osung Advanced Materials (052420) | Whether the 2024 earnings surge was a one-off | Continuity of Q2 operating profit, presence of any dilutive financing | August half-year report |
| Monami (005360) | Market cap recovered on supportive buying sustains itself unaided | H1 results (structural profit and loss), whether market cap holds against the delisting line | August half-year report → October Q3 |
| Hansung Enterprise (003680) | Net profit normalisation and a revenue rebound + market cap sustained unaided | Direction of H1 net profit and revenue | August half-year report → October Q3 |
| THN (019180) | Continuity of the 2025 jump (revenue +52%, operating profit +126%) | H1 operating profit of KRW 35bn+ (a KRW 70bn annual pace), revenue of KRW 550bn+ / falsified if: H1 below KRW 25bn | August half-year report |
The full threshold numbers and falsification conditions for each company are in the individual analyses and on the tracking ledger.
The shape of the ledger — nine experiments of different types
The nine companies were not picked at random; they are arranged so that each one tests a different investment type. Four are earnings stories — companies whose proposition is the direction of profit: Whanin Pharmaceutical (earnings normalisation at the domestic leader in psychiatric drugs), Osung Advanced Materials (durability of an earnings surge), Cuckoo Homesys (maintenance of rental profits) and KT&G (continuation of overseas growth). Two are asset plays — Muhak and SCD, where net cash exceeds market capitalisation and the proposition is not results but “does the cash flow to shareholders?” Two are special situations — Monami and Hansung Enterprise, where the share price is held not by results but by flows (supportive buying) and by regulation (the delisting market-cap standard). And one is a large-cap experiment — a control group testing what happens when the overlooked-stock methodology is applied unchanged to SK Hynix, the most heavily covered company there is.
Different types mean different numbers to watch, even in the same earnings season. Earnings stories call for the income statement; asset plays for the cash flow statement and dividend signals; special situations for market capitalisation itself. That is why the table hangs a different “number to check” on each company.
One step further on each company — where the fork in the road is
SK Hynix — the first report card after digesting KRW 40tn (29 Jul)
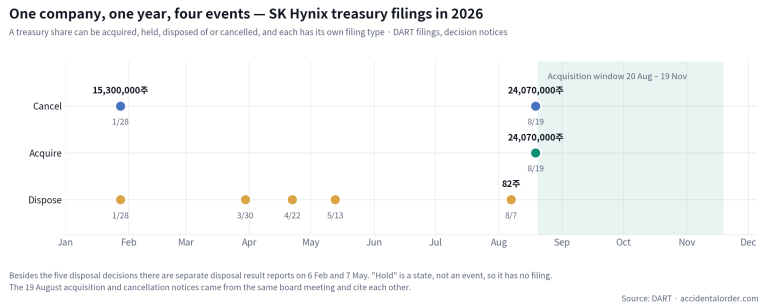
The season opener, and the only large cap on the tracking ledger. In the second week of July this company had the noisiest week of its listed life. It raised roughly KRW 40tn through a Nasdaq ADR listing (issue price KRW 2,249,751, approximately 178m shares), and in the same week the domestic share price fell 15.4% in a single day. That was the tail end of a rally that had taken the stock up twelvefold from its 52-week low. These results are the first quarterly numbers to appear since the commotion.
Whether the raise succeeds cannot be assessed in a single quarter. The proposition in that article is that “cumulative EPS and FCF per share over the four quarters after the issue do not fall below the four quarters immediately before it,” and 29 July is the first notch on that four-quarter clock. Three things are worth looking at right away — the starting point for per-share metrics on the enlarged denominator (approximately 730.49m shares after the issue), the maintenance of the HBM-driven operating margin (48.6% for full-year 2025; the half-year threshold is double digits), and a DRAM revenue share of 75% or more. On top of that comes the question of whether operating cash flow covers capex in a year exceeding KRW 25tn and keeps FCF positive.
Whanin Pharmaceutical — a one-quarter bounce, or a change of direction? (~1 Aug → 13 Aug)
The leader in Korea’s psychiatric-drug market (per the company’s annual report, on IMS data) lost margin from 17.6% down to 5.1% over five years. While cost of sales climbed from 47% to 66% of revenue, sales rose but gross profit actually fell. Then came first-quarter 2026 operating profit of KRW 9.38bn (+77.7% yoy) — a sharp rebound to more than six times the preceding quarter (KRW 1.48bn).
Q2 operating profit of KRW 4.6bn is the fork in the road. Clear it and the H1 pace of KRW 14.0bn keeps the “earnings normalisation” scenario alive; fall below KRW 3.0bn and Q1 is assessed as a one-off. In the half-year report there are two further things to look at behind the headline — whether the 65.9% cost ratio has turned down, and whether operating cash flow, which came to only KRW 970m in Q1, has caught up with profit (KRW 9.38bn). The shareholder-return scenario, which entangles the succession (a gift in October 2025), a 40.8% payout ratio and the disposal of KRW 38bn of treasury shares, will be assessed by the dividend disclosure in February–March next year, so it is a secondary observation this season. Last year the preliminary disclosure came on 1 August.
SCD — the layer of profit has thinned to KRW 510m (~14 Aug)
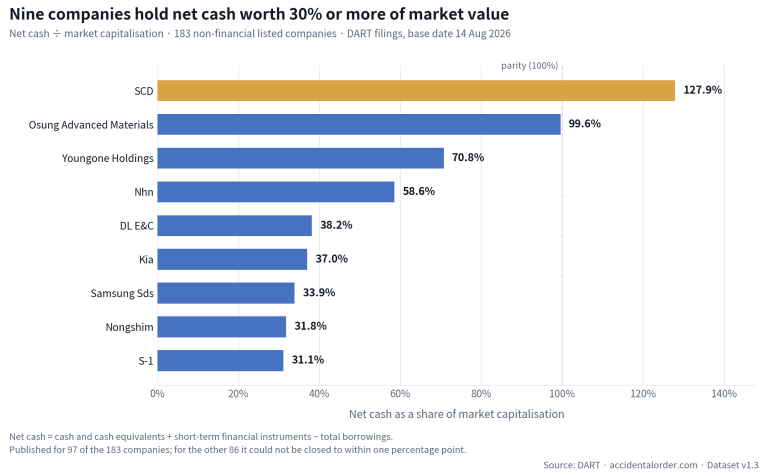
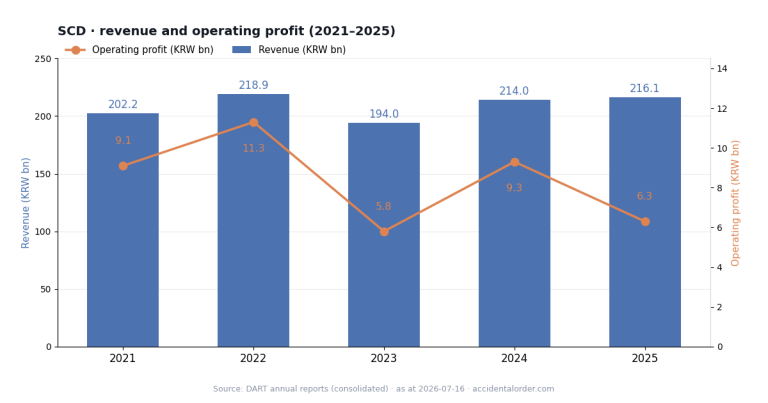
Cash of KRW 73.7bn (debt-free) against a market capitalisation of KRW 63.1bn — an asset play to which the market is assigning a negative value for the business itself. The controlling shareholder is Japan’s Nidec group (51.42%), and the dividend has risen three years running (KRW 30 → 35 → 50, a 3.8% yield). The problem is the premise of the proposition: that the core business stays profitable. Quarterly operating profit has thinned for five consecutive quarters — KRW 2.78bn → 1.63bn → 1.31bn → 590m → 510m. The next step down is a loss.
Whether the company holds a quarterly profit in Q2 is the first assessment line. Hold it and the “core business profitable + rising dividend” proposition stands, with cash and equivalents of KRW 70bn or more and debt-free status as secondary thresholds. Appliance end-demand, raw material prices and exchange rates are the variables, and whether the automotive-parts venture named in the annual report makes its first appearance in the half-year report is a secondary observation.
KT&G — the staying power of +20% in overseas cigarettes (~7 Aug → 14 Aug)
The first entry on the tracking ledger, and the proposition has been narrowed to one thing — does 20%-plus growth in overseas cigarette revenue continue? The domestic tobacco market is flat in volume terms, so the only variable that can change the direction of this company’s report card is overseas. Last year the headline came with a preliminary disclosure on 7 August. If growth falls to single digits the proposition wobbles; if it stays in the 20s, this is a candidate for the first 🟢.
Muhak — does the net cash flow out as dividends and buybacks? (~14 Aug)
The first analysis of an asset play holding net cash larger than its market capitalisation. The proposition has two axes — maintenance of operating profit in the core business (soju and bottled water), and whether the accumulated net cash is transferred to shareholders through dividends and buybacks. In the August half-year report I check the H1 operating profit pace, whether valuation gains and losses on financial assets are obscuring the core business, and whether there is any movement on shareholder returns. Because it is the same asset-play type as SCD, whether the two companies come out the same way is worth watching side by side.
Cuckoo Homesys — the KRW 140bn rental profit pace (~14 Aug)
The starting point was a rental business with KRW 1tn of revenue trading at a PER of 3.9x. The proposition is whether operating profit based on rental accounts is maintained and grows above KRW 140bn a year — measured by annualising the H1 cumulative operating profit. That makes KRW 70bn the half-year line. The transaction structure with the parent company, and growth in overseas rental accounts including Malaysia, are checked together in the notes to the half-year report.
Osung Advanced Materials — the second piece of evidence on the earnings surge (~13 Aug)
The company is accumulating quarter by quarter the evidence that its 2024 earnings surge was not a one-off. For this type of company “the year after the surge” is the hardest — the base is now high. The thresholds are whether Q2 operating profit demonstrates continuity, and whether dilutive financing such as a rights issue or convertible bonds shows up as the price of growth. Last year it filed the half-year report on 13 August.
Monami and Hansung Enterprise — what is left when supportive buying recedes (~14 Aug → October)
These two are special cases where the watch point is market capitalisation itself rather than results. The question is whether market capitalisation recovered on “patriotic consumption” buying can sustain itself unaided while structural profitability has not improved. Monami runs head-on into the increase in the delisting market-cap standard (KOSPI: currently KRW 30bn → KRW 50bn in January 2027) while carrying structural losses, so alongside the H1 results I track its market cap on a long horizon, through the third quarter in October. Hansung Enterprise carries a net loss and falling revenue despite positive operating profit, so whether H1 net profit normalises comes first. For both companies half the assessment rests on the August half-year report and the other half on the trajectory of market capitalisation from October onwards.
Three questions common to this season
Overlay the watch points of all nine companies and they group into three common questions.
First, earnings quality — do profit and cash point the same way? Whanin Pharmaceutical (Q1 profit of KRW 9.38bn versus operating cash flow of KRW 970m) and SK Hynix (FCF amid heavy capex) are the representative cases. A rebound in the income statement that is not confirmed by the cash flow statement is only half a rebound. That is why I read the cash flow statement in the half-year report before the profit line.
Second, the distance between assets and shareholders — does the cash in the vault flow to shareholders? Asset plays whose net cash exceeds market capitalisation, like Muhak and SCD, cannot be assessed on results alone. Whether the conduits of dividends and buybacks are maintained and widened has to be confirmed as well, and because that signal arrives later than results (late in the year through early the next), this season’s assessment concentrates on confirming the premise: that the business is profitable.
Third, regulation and flows — a market where market capitalisation has become a survival requirement. The delisting market-cap standard stepped up in July this year and steps up again in January 2027. For companies that recovered their market capitalisation on supportive buying, like Monami and Hansung Enterprise, this season is a durability test of “a market cap sustained without results.”
Filing calendar (based on measured disclosure dates from last year)
| When | Scheduled event | Basis |
|---|---|---|
| Wed 29 Jul | SK Hynix Q2 results — the season opens | Company’s announced schedule (preliminary disclosure 24 Jul last year) |
| Early August | Whanin Pharmaceutical preliminary results (1 Aug last year) and KT&G preliminary results (7 Aug last year) expected | DART disclosure dates from last year |
| 13–14 Aug | Half-year reports filed for all nine companies — cost ratios, cash flows and notes all become checkable | Statutory deadline 14 Aug; measured 13–14 Aug last year |
| October–November | Monami and Hansung Enterprise Q3 and market-cap trajectory review, Q3 reports for all companies | Statutory deadline for quarterly reports |
For companies with no practice of preliminary disclosure (Monami, Hansung Enterprise, Muhak, Cuckoo Homesys, Osung Advanced Materials and SCD), the half-year report is the first data. Preliminary disclosures and half-year reports serve different roles — a preliminary disclosure gives the headline revenue and operating profit about two weeks early, while the half-year report carries the cost ratio, cash flows, notes and the description of the business. That is why the headline gives a first assessment and the report a precise one. The schedule may shift with company circumstances.
One caution — the numbers in a preliminary disclosure are, literally, provisional. They can differ from the confirmed figures in the half-year report, and modest revisions are not rare. So at the preliminary-disclosure stage the assessment is written down as provisional, and the final assessment is attached using the confirmed figures in the half-year report. The half-year report also carries more weight in that its numbers have been through an auditor’s review. The more overlooked a company is, the more likely it goes straight to the half-year report without a preliminary disclosure, which concentrates the assessments in mid-August.
What gets updated
As results arrive, three places get refreshed.
First, an earnings update is appended to each analysis. The original text is not rewritten; the update is added, so the article URL does not change and the judgement made at the time of analysis sits on the same page as the outcome that followed. Second, the status on the tracking ledger is assessed from ⚪ to 🟢 or 🔴. The basis for the assessment is the numerical threshold hung on each article in advance, and thresholds are not moved after the fact. Third, the outcomes are reflected in the table in this article, so that when the season closes the status table for all nine companies is complete.
In order, SK Hynix on 29 July is the first update, followed by the preliminary disclosures from Whanin Pharmaceutical and KT&G in the first week of August, and then the bulk filing of half-year reports in mid-August. By the end of August, when the season closes, all nine companies will carry their first assessment. The way updates are made follows the principles set from the start — article URLs are not changed, figures are always written with their source (the disclosure receipt number), and past passages that conflict with the assessment are left in place rather than deleted. From a reader’s point of view, bookmarking this one article means you can follow, in one place, which company’s assessment was updated when and how throughout the season.
How to use this if you are new here
If this is your first time at this hub, I would suggest a reading order. Start on the tracking ledger by skimming the propositions and status symbols (🟢🔴⚪⬛) for the nine companies. One screen is enough to grasp what this place does. Next, pick one analysis for a company that interests you and read only the “core scenario” and “next quarter’s watch points” sections first; that fixes which numbers to watch for that company this season. The five-year tables and the pressure-point analysis in the body can wait until after.
I also link the background study pieces. The basics of reading results are covered in how to read financial statements and how to read the cash flow statement; the traps in “looking cheap” are in the traps in PER and PBR; and the trading-value problem specific to overlooked stocks is in overlooked stocks and charts — the liquidity trap. These are concepts that will come up repeatedly in this season’s updates.
What is left when the season ends
By the end of August all nine companies will carry their first assessment. Three things remain at that point. First, a document for each company in which “the proposition at the time of analysis → the actual outcome → the assessment” is recorded side by side on one page. Second, the ratio of 🟢 to 🔴 — the report card on how often The Accidental Order’s method was right and how often it was not. Third, the watch points for the next quarter, refreshed according to the assessments. Companies that come out 🔴 keep their row, preserved along with the reason. I believe the record of successes earns trust only when the record of failures is still there.
In October the second round begins with the Q3 reports, and long-horizon items such as the market-cap tracking of Monami and Hansung Enterprise carry over into next year. Analysis does not end on the publication date; it begins on the publication date — and this ledger is the book of that promise.
Sources and disclosure
Basis for the schedule: measured DART disclosure dates for July–August of last year (2025), and the half-year report filing deadline under the Financial Investment Services and Capital Markets Act. Figures for each company follow the sources in the relevant analysis (DART, KRX). Schedules may change with company circumstances after the date of writing (2026-07-18).
This article is for informational purposes and is not a recommendation to buy or sell any security. Target prices and trade timing are not addressed.
Update log
- 2026-08-15 — Each company covered here now has its own filing-traceable data page: price-to-book against total equity and against the owners’ share, five years of revenue, profit, equity and net cash, and the dividend, treasury and cancellation record — every figure beside the DART receipt it was read from. → SK Hynix (000660) · KT&G (033780) · Monami (005360) · Hansung Enterprise (003680) · Muhak (033920) · Cuckoo Homesys (284740) · Osung Advanced Materials (052420) · Whanin Pharm (016580) · SCD (042110)
Get the next quarterly update for this company by email
When the next results are filed we send where this scenario stands. Nothing else.