LG Energy Solution H1 2026: Revenue up 10.5%, but a KRW 94.0bn operating loss
A few days ago we set out the figures showing that Samsung Electronics and SK Hynix together earned KRW 244.88tn in operating profit in the first half of 2026. Over the same six months, in the same country, the books of the country’s flagship battery maker read like this.
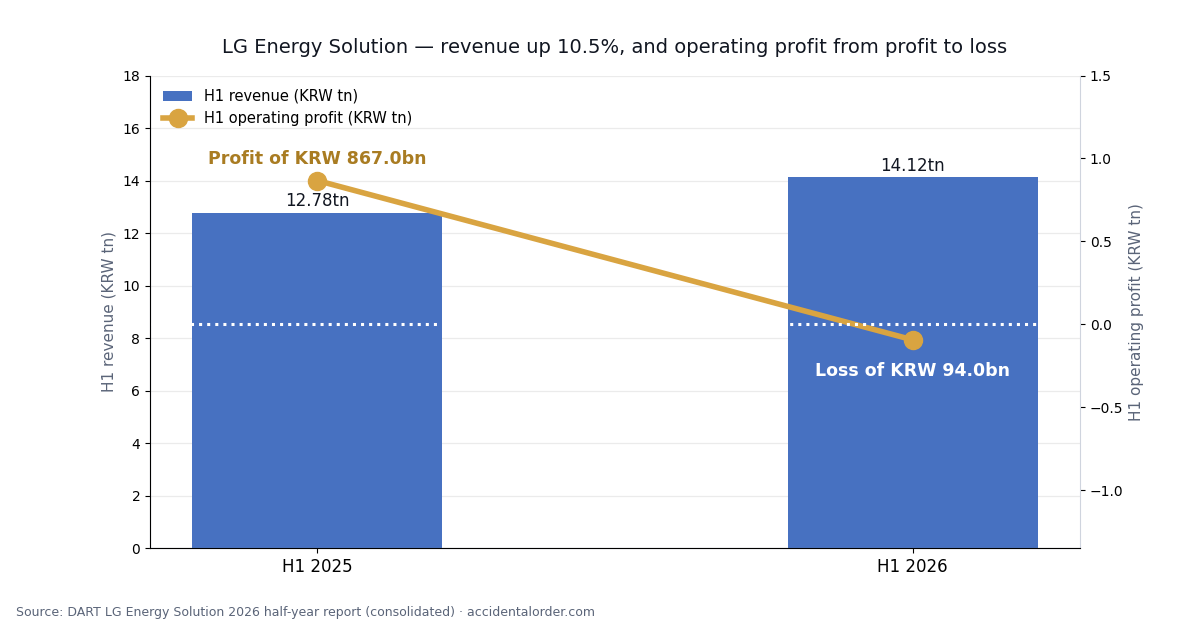
LG Energy Solution’s consolidated operating profit for the first half of 2026 was KRW −94.0bn. In the same period a year earlier it was a profit of KRW 867.0bn. Revenue actually grew (KRW 12.779tn → KRW 14.115tn, +10.5%), yet the profit line crossed from black to red.
This piece looks at where that reversal came from, using nothing but the numbers in the half-year report (banyeon bogoseo, filed within 45 days of the half-year close) submitted on 13 August.
The disclosed numbers, as filed
| H1 2026 (consolidated) | 2026 | 2025 | Change |
|---|---|---|---|
| Revenue | KRW 14.115tn | KRW 12.779tn | +10.5% |
| Operating profit | KRW −94.0bn | +KRW 867.0bn | Swing to loss |
| Net loss attributable to controlling interests | KRW −1.053tn | KRW −443.0bn | Loss widened |
| Operating margin | −0.7% | +6.8% | — |
What deserves attention is that the net loss is far larger than the operating loss. The company lost KRW 94.0bn at the operating line, but the net loss attributable to controlling interests is KRW 1.053tn. Finance income for the half year is booked at KRW 1.164tn, and the net loss is still this large — which means that costs bigger than that were incurred below the operating line. The composition of those costs is a matter to check separately in the notes to the report; here we record only the totals that have been confirmed.
That said, Q2 on its own was profitable
Stopping at the half-year figure alone would miss something important. The first-half operating loss of KRW 94.0bn is the sum of two quarters, and split apart it looks like this.
| 2026 | Operating profit |
|---|---|
| Q1 | KRW −207.0bn (loss) |
| Q2 | +KRW 113.0bn (profit) |
| H1 total | KRW −94.0bn |
In other words, the company lost heavily in Q1 and returned to profit in Q2. Judged on direction alone, it is improving. So neither “the battery business has collapsed” nor “it has already recovered” can be asserted from these numbers. Only two things are confirmed — the half-year cumulative figure is still a loss, and the most recent quarter is a profit.
Set the margins side by side
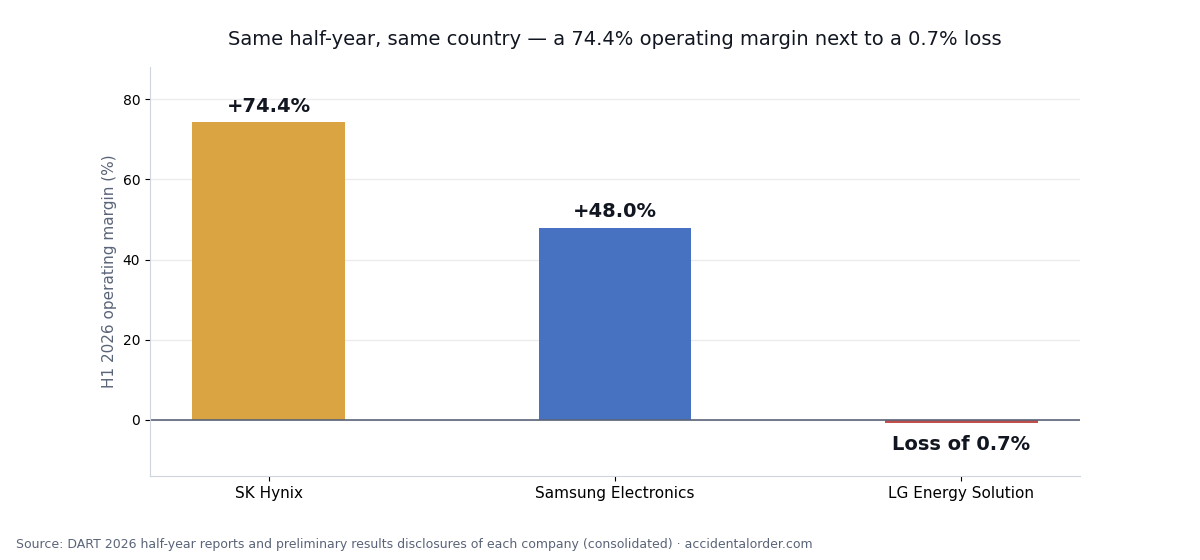
Writing out the operating margins for the same six months makes the gap plain. SK Hynix 74.4%, Samsung Electronics 48.0%, LG Energy Solution −0.7%.
The three companies are in different businesses, so margins cannot rank one above another. What the picture does say is that the single sentence “Korean large-cap manufacturing had a good first half in 2026” does not hold. Semiconductors and batteries wrote opposite books over the same period. Lump them together into an index or a sector average and that difference disappears.
Most of the asset growth is debt
| (Consolidated) | End-June 2026 | End-2025 | Change |
|---|---|---|---|
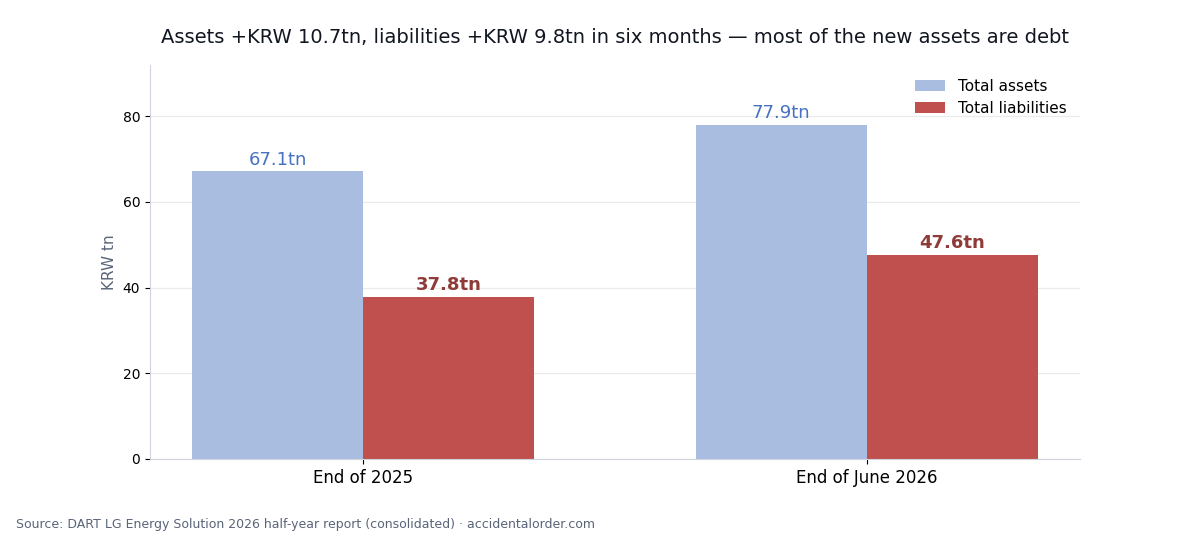
| Total assets | KRW 77.878tn | KRW 67.148tn | +KRW 10.73tn |
| Total liabilities | KRW 47.591tn | KRW 37.826tn | +KRW 9.765tn |
| Total equity | KRW 30.287tn | KRW 29.322tn | +KRW 965.0bn |
| — Controlling-interest equity | KRW 22.342tn | KRW 20.216tn | +KRW 2.126tn |
| — Non-controlling interests | KRW 7.944tn | KRW 9.106tn | −KRW 1.162tn |
Assets grew by KRW 10.73tn over six months, of which KRW 9.765tn was an increase in liabilities. Put differently, 91% of the additional assets were funded with debt. Equity rose by only KRW 965.0bn.
Batteries are an industry that builds plants first and sells later, so rising debt during an investment phase is not in itself odd. The issue is the pace. If liabilities grew by KRW 9.765tn in a half year that ended in a loss, then when that investment turns into profit will decide the company’s next several years. Interest goes out every quarter, while a plant earns money several years later.
And yet this is the price the market puts on the company
| As at 2026-08-13 | Value |
|---|---|
| Closing price | KRW 365,500 |
| Shares outstanding | 234,000,000 shares (no treasury shares) |
| Market capitalisation | approx. KRW 85.53tn |
| Controlling-interest equity | KRW 22.342tn |
| PBR (on controlling-interest equity) | approx. 3.83x |
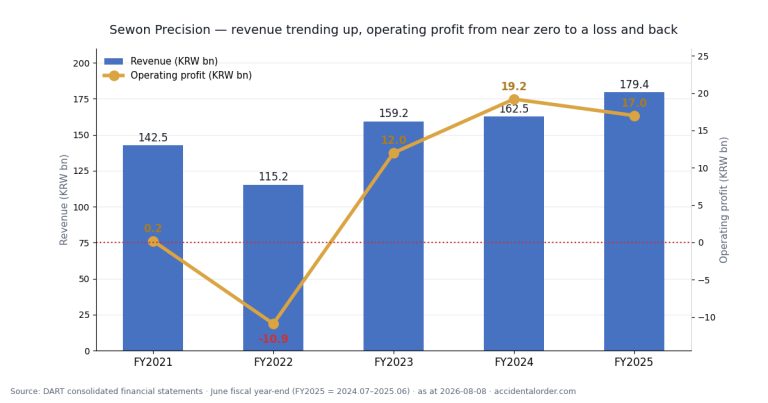
A company that posted a first-half loss trades at 3.8 times the equity attributable to its shareholders. Sewon Precision, which we covered a few days ago, was profitable and traded at 0.16 times shareholders’ equity. Same market, same arithmetic, and a 24-fold difference.
That does not mean the gap is itself a mistake. The market prices future profit, not present profit, and batteries carry that expectation. But an expectation is only an expectation until the numbers confirm it, and a PBR of 3.8x also means the premise “profit will grow substantially from here” is already inside the price. Which is precisely why, with a stock like this, it is better to fix in advance, in numbers, the point at which expectation turns into results. (→ The PER and PBR trap)
The longer view — a three-year path
| (Consolidated) | 2024 | 2025 | H1 2026 |
|---|---|---|---|
| Revenue | KRW 25.62tn | KRW 23.67tn | KRW 14.115tn |
| Operating profit | KRW 580.0bn | KRW 1.35tn | KRW −94.0bn |
| Net profit | KRW 340.0bn | KRW 80.0bn | — |
Going from 2024 to 2025, revenue fell (KRW 25.62tn → KRW 23.67tn) yet operating profit rose (KRW 580.0bn → KRW 1.35tn). That is a structure in which profit can grow even as sales shrink. Then in the first half of 2026 revenue grew and profit went into loss. Revenue and profit do not move in the same direction at this company, and that is what makes the stock hard to read.
For reference, in 2025 the company posted operating profit of KRW 1.35tn and yet net profit of only KRW 80.0bn. Most of the profit disappeared below the operating line back then too, and this looks like the same family of phenomenon as the large net loss in the first half of 2026. We intend to check the notes and treat this separately in a later piece.
Non-controlling interests fell by KRW 1.162tn
There is one more line in the balance sheet that is easy to miss but worth flagging. Within equity, non-controlling interests fell from KRW 9.106tn to KRW 7.944tn, a decline of KRW 1.162tn. Over the same period the controlling-interest share rose by KRW 2.126tn.
Non-controlling interests are the portion of consolidated subsidiaries that does not belong to this company’s shareholders. There are several routes by which that amount can fall — the parent bought more of a subsidiary and enlarged its own share; a subsidiary made losses and the other side’s share was written down; or the consolidation structure changed. In fact, the half-year income statement records a net loss attributable to non-controlling interests of KRW 219.0bn, which confirms that losses also arose on the subsidiary side.
The exact cause requires reading the notes on changes in the scope of consolidation together with the statement of changes in equity. Here we record only this much: “equity looks larger, but its composition has changed.” Read only the total-equity line of a consolidated set of accounts and this entire movement stays invisible. (→ Consolidated vs separate financial statements)
How batteries differ from semiconductors
Both industries require large-scale capital investment and both are cyclical. Yet there are structural reasons why the results of these six months landed at opposite ends.
First, the number of customers differs. Memory chips are sold to a very large number of server and device makers worldwide, whereas batteries are supplied in volume to a small number of carmakers. Few customers means weaker leverage on price, and if one customer’s plan slips, plant utilisation moves immediately.
Second, raw materials make up a large share of cost. When metal prices such as lithium and nickel move, costs move with them, and that movement is hard to pass straight through to selling prices. In this half year, too, revenue grew 10.5% while cost of sales rose from KRW 9.816tn to KRW 11.329tn, up 15.4% — faster than revenue. That is why gross profit fell, from KRW 2.963tn to KRW 2.787tn.
Third, the interval between spending and recovery is long. Several years sit between the decision to build a plant and the point at which that plant earns a profit. If the demand outlook changes in the meantime, capacity already built becomes a burden. The present phase — liabilities up KRW 9.765tn in half a year — is exactly that stretch.
Handle these numbers with care
Finally, a note on the places where the figures in this piece are easiest to misuse.
Do not mix half-year and quarterly figures. The first-half operating loss of KRW 94.0bn and the second-quarter profit of KRW 113.0bn are both correct, but quoting only one of them leaves exactly the opposite impression. That is why this piece put both into a single table.
Read growth rates together with absolute amounts. “Net loss widened 138%” sounds enormous; writing that the loss grew by KRW 610.0bn, from KRW 443.0bn to KRW 1.053tn, lets you gauge the size.
Keep consolidated and separate accounts apart. Every figure in this piece is on a consolidated basis. For the same company the separate financial statements produce different numbers, and the difference is largest at companies with many subsidiaries.
What to check next
This is not yet a company on which we have set a numerical threshold. But what to look at next quarter has already been settled by this report.
① Does the Q2 profit continue into Q3? — Q1 was KRW −207.0bn, Q2 was +KRW 113.0bn. A profitable Q3 confirms the direction; a return to loss would mean Q2 was a one-off.
② The gap between operating profit and net profit — a half-year operating loss of KRW 94.0bn against a controlling-interest net loss of KRW 1.053tn. Does that gap narrow, or keep widening?
③ The pace of debt growth — up KRW 9.765tn in half a year. The same pace in Q3 would mean the investment phase is still in full swing.
All three will be visible in the Q3 report in November. At that point we will attach an update log to this piece, and if we judge the stock worth setting a threshold on, we will add it to stock tracking.
Summary
In the first half of 2026, two semiconductor companies earned KRW 244.88tn and the country’s flagship battery maker lost KRW 94.0bn. The same six months.
LG Energy Solution’s revenue grew 10.5%, but operating profit crossed from black to red and the net loss attributable to controlling interests widened from KRW 443.0bn to KRW 1.053tn. Liabilities rose KRW 9.765tn over six months, and even so the shares sit at 3.8 times the equity attributable to shareholders. The move from a Q1 loss to a Q2 profit is a clear sign of improvement, but the half-year cumulative figure is still a loss.
Rather than buying because the numbers look good or selling because they look bad, it is better to write down in advance what would have to be confirmed next quarter to change your mind. The three items above are that list.
This piece does not recommend buying or selling any particular stock, and offers neither price targets nor trade timing. All figures are based on DART electronic disclosures and KRX data; the financials are from the 2026 half-year report (consolidated) and the share price is the closing price of 13 August 2026. For details, please see the disclaimer.
Update log
- 2026-08-15 — Each company covered here now has its own filing-traceable data page: price-to-book against total equity and against the owners’ share, five years of revenue, profit, equity and net cash, and the dividend, treasury and cancellation record — every figure beside the DART receipt it was read from. → SK Hynix (000660) · Samsung Electronics (005930) · LG Energy Solution (373220)
Get the next quarterly update for this company by email
When the next results are filed we send where this scenario stands. Nothing else.