Samsung Electronics and SK Hynix H1 2026: KRW 244.9tn in operating profit, and the quarter the margins flipped
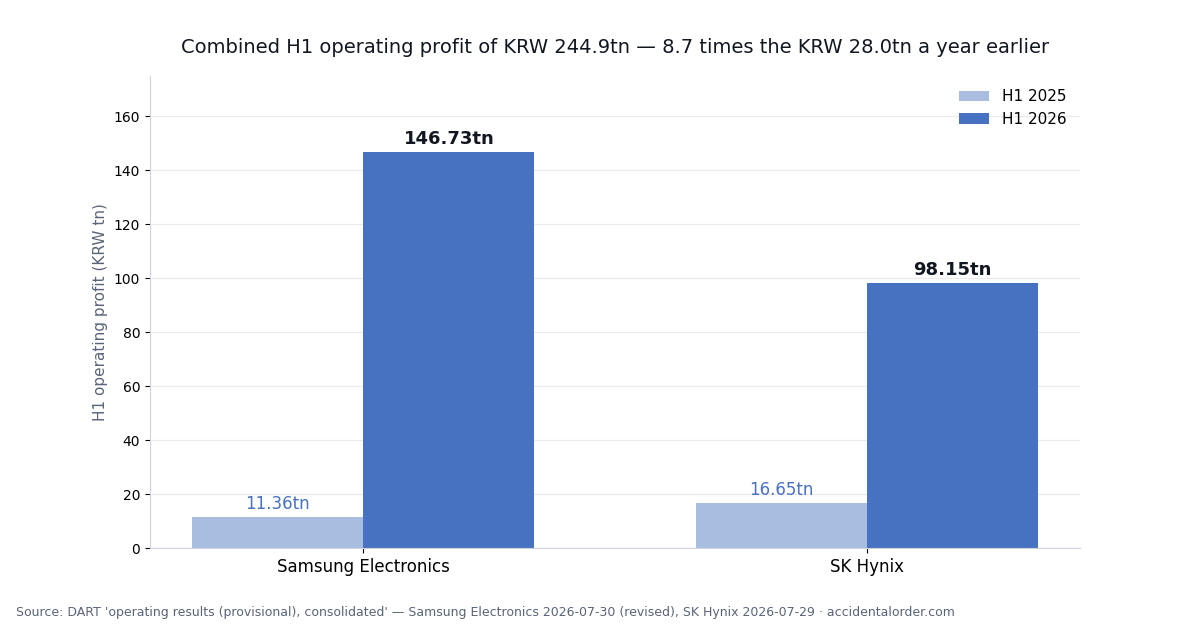
Add up the operating profit that Samsung Electronics and SK Hynix earned in the first half of 2026 and you get KRW 244.88tn. A year earlier, over the same period, the two companies together made KRW 28.01tn. That is 8.7 times as much.
It is the kind of change whose scale is hard to feel, because the numbers are simply too large. So this piece sets the two companies’ disclosed preliminary results side by side and picks out one thing that is less widely noticed within them: that operating margins flipped in the second quarter.
First, the disclosed numbers as filed
Both companies disclosed preliminary second-quarter results at the end of July. Samsung Electronics filed on 7 July and then issued a corrected disclosure on 30 July; the figures below are the corrected final ones.
| Q2 2026 (consolidated, KRW tn) | Samsung Electronics | SK Hynix |
|---|---|---|
| Revenue | 171.50 | 79.32 |
| Operating profit | 89.49 | 60.54 |
| Operating margin | 52.2% | 76.3% |
| Revenue growth vs a year earlier | +130.0% | +256.8% |
| Operating profit growth vs a year earlier | +1,813.8% | +557.2% |
| H1 2026 cumulative (consolidated, KRW tn) | Samsung Electronics | SK Hynix | Total |
|---|---|---|---|
| Revenue | 305.37 | 131.90 | 437.27 |
| Operating profit | 146.73 | 98.15 | 244.88 |
| Operating profit, H1 a year earlier | 11.36 | 16.65 | 28.01 |
| Operating margin | 48.0% | 74.4% | — |
Samsung Electronics’ first-half operating profit growth is +1,191.5%, and for the second quarter alone +1,813.8%. Part of the reason the percentage prints in four digits is that the comparison base, second-quarter operating profit a year earlier, was a very low KRW 4.68tn. A low base makes a growth rate look exaggerated. Which is why the absolute amount has to be read alongside it — from KRW 4.68tn to KRW 89.49tn, quarterly operating profit grew by KRW 84.8tn.
The less noticed part — margins flipped in Q2
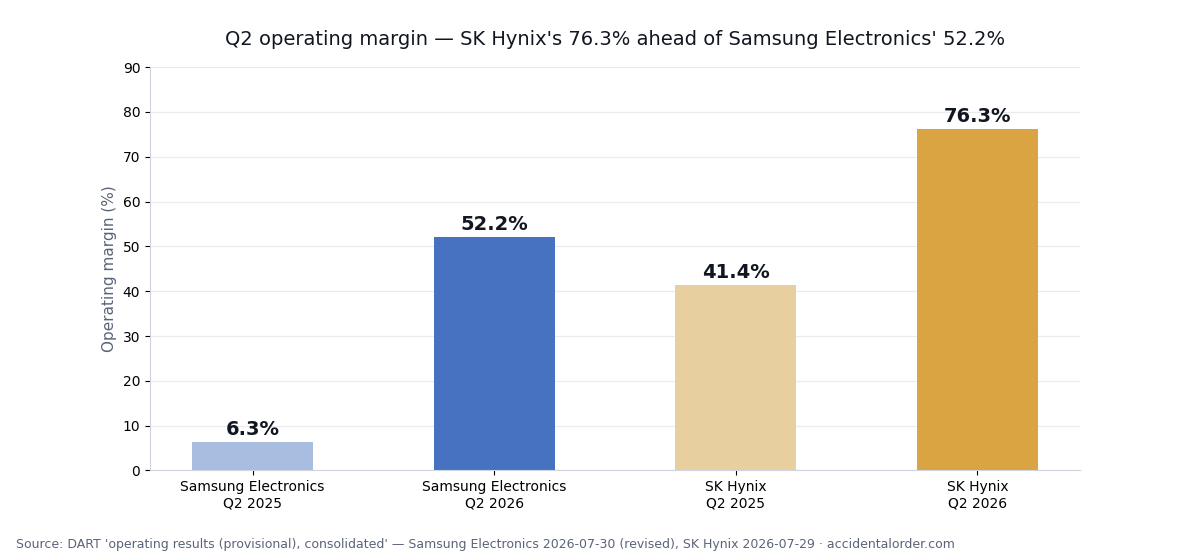
On revenue, Samsung Electronics is more than twice the size of SK Hynix (KRW 171.50tn against KRW 79.32tn). And yet SK Hynix’s operating margin of 76.3% is 24.1 percentage points above Samsung Electronics’ 52.2%.
A year ago that was not the case. In the second quarter of 2025 the operating margins were 6.3% for Samsung Electronics and 41.4% for SK Hynix. Hynix was higher then too, but both were in a different world from today. Margins rose sharply at both companies, and the rise was larger at Hynix.
Translated into what that difference produces per unit of revenue, it looks like this.
Samsung Electronics sold KRW 1,000 worth of goods and kept KRW 522.
SK Hynix sold KRW 1,000 worth of goods and kept KRW 763.
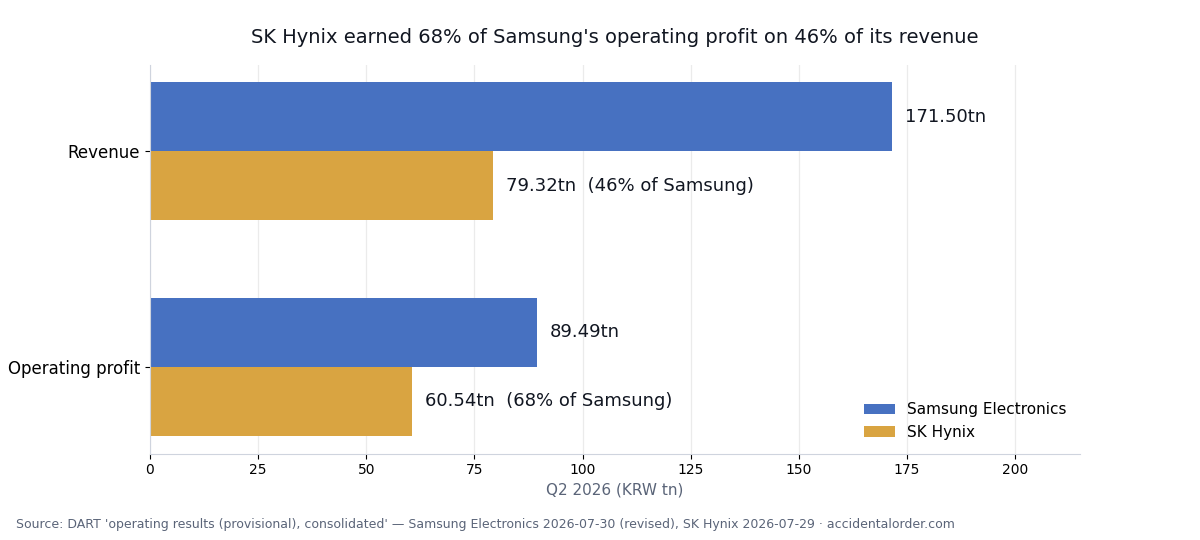
So SK Hynix earned 68% of Samsung Electronics’ operating profit on 46% of its revenue. Two companies with different business mixes cannot be ranked against each other on margin alone. Samsung Electronics carries foundry, displays, mobile and home appliances alongside memory, and mixing in lower-margin businesses pulls the group margin down. SK Hynix is a structure concentrated on memory. Still, to the question of which company turns the same KRW 1,000 of revenue into more profit, this quarter at least gives a clear answer.
How the market prices that gap
Calculated on the closing prices of 13 August 2026, the two companies’ market capitalisations are as follows.
| As at 2026-08-13 | Samsung Electronics | SK Hynix |
|---|---|---|
| Closing price | KRW 268,000 | KRW 1,593,000 |
| Ordinary shares outstanding | 5,919,637,922 shares | 730,492,365 shares |
| Market capitalisation (ordinary shares) | approx. KRW 1,586.5tn | approx. KRW 1,163.7tn |
| Relative ratio | 100% | 73.3% |
Measured by second-quarter operating profit, SK Hynix is 67.6% of Samsung Electronics; measured by market capitalisation, it is 73.3%. In other words, the market prices Hynix slightly more generously than this quarter’s profit gap alone would imply. That difference can be read as “overvaluation” or as “a premium for a memory-concentrated structure”. We do not argue for either reading. But writing the two ratios down side by side means we can check later which of them moves.
What we still do not know
That is as far as the disclosed numbers go. Let us also be clear about what this piece does not say.
First, the segment breakdown is not yet inside these numbers. A preliminary results disclosure carries only company-wide totals such as revenue and operating profit. How much memory and foundry each earned, and how the DRAM and NAND mix has shifted, only becomes visible in the half-year report (banyeon bogoseo, filed within 45 days of the half-year close) submitted in mid-August. For reference, SK Hynix’s 2025 consolidated DRAM revenue was KRW 74.9tn, or 77.1% of the total.
Second, these are preliminary figures. Both disclosures are self-prepared closing figures on which the external auditor’s review is not complete, and both state explicitly that they may differ from the final numbers. Samsung Electronics has already corrected its 7 July disclosure on 30 July.
Third, below the operating line is a different story. SK Hynix’s second-quarter net profit attributable to controlling interests was KRW 93.82tn, larger than its operating profit of KRW 60.54tn. That means items from outside operations were correspondingly large, and their composition is another matter for the half-year report. Net profit exceeding operating profit is in itself neither a good nor a bad sign, and the right course is to withhold judgement until the source is confirmed. (→ How to read the cash flow statement)
The growth-rate trap — how to read a four-digit percentage
The most eye-catching number in this set of results is Samsung Electronics’ +1,813.8%. But that number does not mean the company became eighteen times better. Growth rates get larger the smaller the denominator. Because the comparison base, second-quarter 2025 operating profit, was KRW 4.68tn — a value pressed far below normal — the multiple jumped into four digits.
The same trap works in the opposite direction. Take a quarter of high profit like this one as the base, and next year the growth rate prints as negative even while the company is still making very large profits. That is why judging a cyclical industry on year-on-year growth alone always leaves you a beat late, or reading the direction backwards.
So this piece has always written growth rates and absolute amounts together. Samsung Electronics’ quarterly operating profit grew from KRW 4.68tn to KRW 89.49tn, an increase of KRW 84.8tn, and SK Hynix’s grew from KRW 9.21tn to KRW 60.54tn, an increase of KRW 51.3tn. The percentage is background; the material for judgement is the absolute amount and the margin.
Memory always swings like this
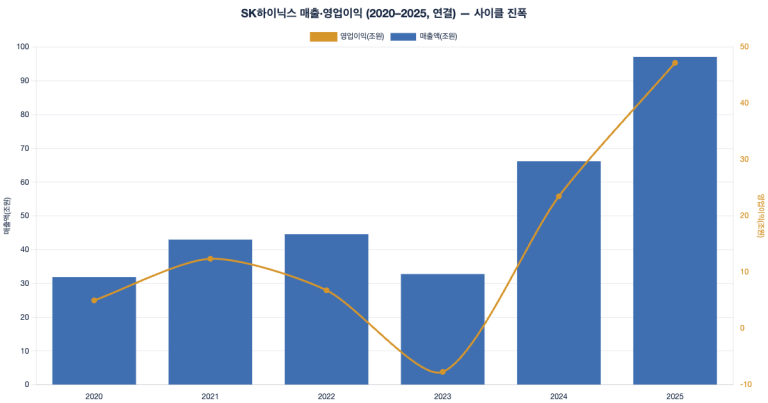
How extreme the present numbers are becomes clear when you compare the same company with itself three years ago. SK Hynix’s consolidated revenue grew from KRW 32.8tn in 2023 to KRW 97.1tn in 2025, and operating profit moved from a loss of KRW 7.7tn in 2023 to a profit of KRW 47.2tn in 2025. Then in 2026 it earned KRW 98.15tn in half a year. (Source: DART consolidated financial statements)
Memory takes a long time to add capacity, and demand moves first in the meantime. When supply is short, prices rise quickly and margins spike; when supply catches up, prices fall and results can go all the way to a loss. A record that travelled from KRW −7.7tn to KRW 47.2tn in three years shows that amplitude exactly.
This matters for one reason. Just as today’s 76% margin is not normal, the loss three years ago was not normal either. In a cyclical industry, one quarter’s numbers tell you where you are in the cycle rather than how good the company is. Which is why, with stocks like these, what to watch is not one good quarter but whether a pre-set standard is cleared across several quarters.
We treat large caps the same way we treat overlooked stocks
The Accidental Order looks for overlooked small caps that brokerage research never reaches, and at the same time treats the most heavily covered large caps in exactly the same way. There is one method we apply regardless of market capitalisation — analyse from the financial data, set a threshold expressed in numbers, and track the status at every quarterly result.
Large caps are difficult not because information is scarce but because there is too much of it. It is hard to tell what is an actually confirmed number and what is still a forecast. That is why this piece uses only the values written in the preliminary disclosures, and states plainly that things not yet disclosed — such as the segment breakdown — are unknown.
What to do with these numbers
The mere fact that results were good yields no judgement at all. Good results may already be in the price, or they may not be. So instead of pronouncing results good or bad after they arrive, we set numerical thresholds in advance and track each quarter whether those thresholds are cleared.
SK Hynix already has a threshold in place. It is a baseline for whether per-share earnings hold up despite the share count enlarged by the rights issue and the ADR listing: cumulative net profit attributable to controlling interests over the four quarters immediately before the raise of KRW 161.97tn, which on the post-issue share count is KRW 221,721 per share. Because the issue results were announced on 15 July, the “four quarters after the raise” start counting from the third quarter. The detailed calculation is written up in the update log of our SK Hynix analysis.
Samsung Electronics is not yet a company on which we have set a threshold. This half-year’s numbers are a record intended to fix the starting point, and we plan to take it up after checking the half-year report, where the segment breakdown appears.
What to watch next
① The segment breakdown in the half-year reports — how much of each company’s profit came from which business. In particular, the margin gap between Samsung Electronics’ semiconductor division and its other divisions.
② Whether the operating margins hold — whether SK Hynix stays in the 70s and Samsung Electronics in the 50s in the third quarter. This is the first indicator to move when memory prices change direction.
③ SK Hynix’s first quarter after the raise — from the third quarter the count towards the KRW 221,721 per-share baseline begins.
All three will be visible in next quarter’s results and reports. As each is confirmed, we will update the status here and in stock tracking.
Summary
In the first half of 2026 the two companies’ combined operating profit was KRW 244.9tn, 8.7 times the level of a year earlier. Samsung Electronics’ quarterly operating profit rose from KRW 4.68tn to KRW 89.49tn, and SK Hynix’s from KRW 9.21tn to KRW 60.54tn.
The less conspicuous fact inside that is the split in second-quarter operating margins — SK Hynix 76.3%, Samsung Electronics 52.2%. A company with less than half the revenue earned two-thirds of the profit. Whether that gap is structural, coming from the difference in business mix, or temporary, coming from where each sits in the cycle this quarter, can only be settled by looking at the segment numbers — and those numbers are in the half-year reports.
This piece does not recommend buying or selling any particular stock, and offers neither price targets nor trade timing. All figures are based on DART electronic disclosures and KRX data; the results are from each company’s preliminary Q2 2026 disclosure and the share prices are the closing prices of 13 August 2026. For details, please see the disclaimer.
Update log
- 2026-08-15 — Each company covered here now has its own filing-traceable data page: price-to-book against total equity and against the owners’ share, five years of revenue, profit, equity and net cash, and the dividend, treasury and cancellation record — every figure beside the DART receipt it was read from. → Samsung Electronics (005930) · SK Hynix (000660)