Screening Methodology for Overlooked Stocks — How 2,765 Companies Became 207
📚 Series: Investing Study — a methodology piece that opens up how The Accidental Order’s company analyses get made.
※ Data basis: prices and trading value are KRX closing data for 2026-07-17 (queried 2026-07-18); financials are from the DART 2025 annual report. DART is Korea’s mandatory electronic disclosure system. Every number at every stage below is a measured result from a screening run actually executed for this article.
The Accidental Order sets out to “analyse companies with data, including the ones brokerage research never reaches.” But more than 2,700 companies are listed in Korea, and the great majority of them are exactly the ones research never reaches. Where do you start? Without an answer to that question, analysis of overlooked stocks degenerates into a list of whatever names happened to catch the eye.
So I use a funnel. It starts from the entire market and strips candidates away one mechanically verifiable layer at a time. This article publishes the full blueprint of that funnel — why each cut was drawn where it was, how many names survive if you run it today, and what the filter fails to see. And the companies the filter cannot catch — that is precisely where The Accidental Order’s analysis begins.
The starting point — a market where market capitalisation became a survival requirement
A regulatory change this year underlies the design of this funnel. Under the Financial Services Commission’s overhaul of the delisting regime, the market-capitalisation exit threshold is being raised in stages. From July 2026, a KOSPI company below KRW 30bn or a KOSDAQ company below KRW 20bn breaches the market-cap requirement, and in January 2027 that rises again to KRW 50bn on KOSPI and KRW 30bn on KOSDAQ (Financial Services Commission, “Delisting Reform Plan for the Swift and Rigorous Exit of Failing Companies”). KOSDAQ is Korea’s growth-company market.
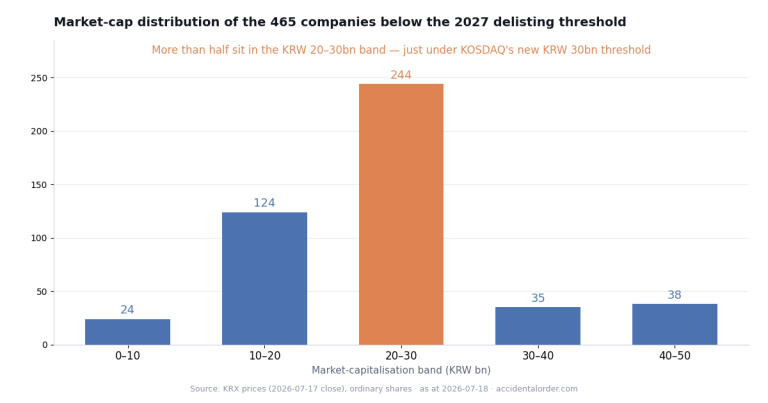
For an investor in overlooked stocks this is not background reading; it is a matter of life and death. Where “small and cheap” used to be the language of opportunity, a small market capitalisation can now mean the company is a delisting candidate. As of today 174 companies sit below the current threshold, and 465 fall below it once the January 2027 standard is applied (common shares only, own tally). So the market-cap filter in this funnel does not say “smaller is better.” It cuts out the band that sits above the survival line but below the reach of research coverage.
Six cuts — the reasoning behind each stage, and the measured counts

| Stage | Condition | Remaining | Change vs prior |
|---|---|---|---|
| Start | All KOSPI + KOSDAQ listings | 2,765 | — |
| ① | Common shares only (preferred shares, SPACs, REITs etc. excluded) | 2,550 | −215 |
| ② | Financials and holding companies excluded | 2,424 | −126 |
| ③ | Market-cap window: at or above the delisting line (KOSPI KRW 50bn / KOSDAQ KRW 30bn) and below KRW 1tn | 1,716 | −708 |
| ④ | Liquidity proxy: trading value on the query date between KRW 10m and KRW 500m | 1,003 | −713 |
| ⑤ | Financial survival: operating profit positive in the 2025 accounts, no capital impairment | 699 | −304 |
| ⑥ | Valuation: PBR below 0.5x and operating profit / market cap of 10% or more | 207 | −492 |
The reasoning behind each stage runs as follows.
① Common shares only. Preferred shares have a different delisting framework and a different liquidity structure, and SPACs, REITs and infrastructure funds are not operating businesses, so they are excluded from the analysis universe. That removes 215 names.
② Financials and holding companies excluded. Banks, insurers, brokers and consumer-finance companies speak a different accounting grammar from manufacturers and service businesses. Applying common yardsticks such as PBR and operating profit to them produces distortion, so they come out of the funnel wholesale (126 identified on the basis of sector classification and company name). Holding companies are also excluded on principle in this series, because of double counting and the structural holding-company discount. That said, this is also the least precise stage of the funnel — I return to it under “If you want to run this properly” below.
③ The market-cap window — above the survival line, below coverage. The lower bound is the delisting line that takes effect in January 2027. Putting a company into the candidate pool today at a market capitalisation that will breach the exit requirement next year is putting a time bomb into the pool, so I cut ahead of time on next year’s standard. The KRW 1tn upper bound is the boundary of coverage — once market cap passes KRW 1tn, brokerage research and institutional flow start to attach themselves, and the premise of being “overlooked” collapses. 1,716 companies remain inside this window. Another way to read that: two-thirds of all listed companies sit above the survival line and outside coverage.
④ The trading-value proxy — direct evidence of neglect. The most honest measure of neglect is not the number of research reports but trading value. Nobody trades what nobody looks at. I treat daily trading value below KRW 500m as the overlooked band, but exclude anything below KRW 10m — a company whose trading has disappeared altogether cannot be bought or sold no matter how well you analyse it, and there is also the risk of breaching the liquidity requirement for continued listing. 1,003 companies remain. For reference, the median daily trading value among the companies that cleared the market-cap window is KRW 300m. Half of the Korean market does not trade KRW 300m in a day.
⑤ Financial survival — profit and equity. From here on it is DART. I pulled the 2025 annual-report financials for all 1,003 companies (consolidated where available, separate otherwise) and removed anyone with an operating loss or total equity at or below zero. The most common trap in overlooked stocks is distress that merely looks cheap, so I demand operating profit and positive equity as minimum evidence of survival. 304 drop out and 699 remain — meaning that even among the quiet companies trading less than KRW 500m a day, 70% are profitable at the operating line.
⑥ Valuation — half the book, ten times the earnings. Finally I ask about price. I require PBR below 0.5x (a price at which the market will not pay even half of total equity) and operating profit / market cap of 10% or more (a double-digit earnings yield against market cap) at the same time. This dual condition leaves only the intersection of “cheap on assets and cheap on earnings.” 207 names — that is today’s candidate pool.
The face of the 207 — statistics on what survived
Looking at the composition of the final 207 gives a feel for what kind of company this funnel picks out (all figures measured today).
| Item | Bottom 25% | Median | Top 25% |
|---|---|---|---|
| Market capitalisation | KRW 56.2bn | KRW 86.9bn | KRW 135.9bn |
| PBR | 0.26x | 0.34x | 0.43x |
| Operating profit / market cap | 16.7% | 23.8% | 35.2% |
Market composition: 92 on KOSPI · 115 on KOSDAQ
The medians alone reveal the character of this pool. Market capitalisation of KRW 86.9bn — a size that attracts almost no research. PBR of 0.34x — the market is quoting these companies’ equity at a third of book. Operating profit / market cap of 23.8% — at last year’s operating profit alone, a little over four years of earnings would buy the entire market capitalisation. These numbers do not, of course, denote nothing but attraction. There is usually a reason the market quotes this price (liquidity, governance, earnings quality, a declining industry), and working out whether that reason holds up is the job that comes after the funnel. One thing is clear, though: the very fact that a market contains more than 200 companies at prices like these is why analysing overlooked stocks is a coherent activity at all.
The case for the thresholds — why those numbers in particular
The four thresholds in the filter can look arbitrary, so I set down the reasoning. The KRW 1tn market-cap ceiling is a conservative estimate of where coverage begins — some companies pick up research from the mid-hundreds of billions of won, but companies above KRW 1tn that are still overlooked are rare. Trading value of KRW 500m comfortably covers the median (KRW 300m) among companies that cleared the market-cap window, and approximates “liquidity into which an institution cannot enter at meaningful size.” PBR of 0.5x is the halfway point of the liquidation-value logic — the traditional standard that at half of book value there is room left over even after discounting asset quality substantially. Operating profit / market cap of 10% comes from a required-return perspective — in return for bearing the liquidity risk and information asymmetry of overlooked stocks, I want an earnings yield well above bond and deposit yields at the starting line. None of the four values is a “right answer”; each is a declaration. Change the values and the funnel changes — the point is to write the values down before you run it and not move them to suit the result.
The companies outside the filter — opportunity lives where the machine cannot see
Read this far and the funnel looks fairly convincing. Now let us look at what it actually misses. Every example below is a measured case drawn from companies The Accidental Order has already analysed and published.
Case ① It cannot see the direction of earnings — Whanin Pharmaceutical. Whanin Pharmaceutical fails stage ⑥ as of today, because operating profit / market cap is 7.0%, short of the 10% threshold. But the numerator is 2025 full-year operating profit of KRW 13.0bn — the figure from the year earnings bottomed out. The filter has no way of knowing that operating profit rebounded sharply to KRW 9.38bn in the first quarter of 2026. A mechanical filter running on annual accounts is always six months to a year late. The closer a company is to the start of a recovery, the more likely it sits outside the filter.
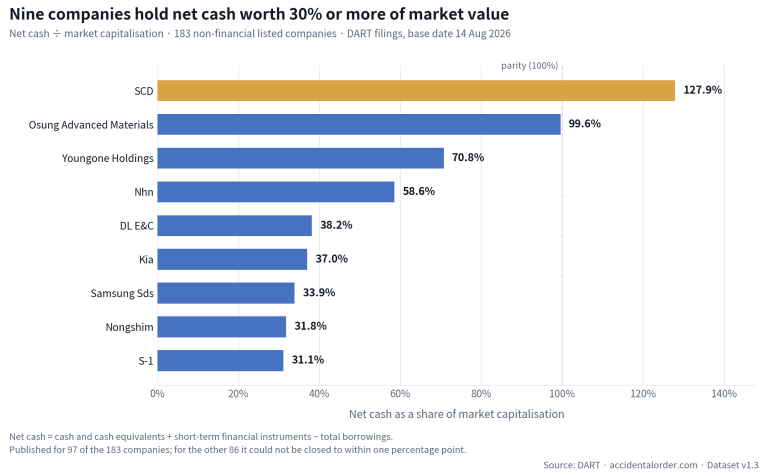
Case ② It misses asset plays — Muhak. Muhak clears the asset test comfortably at a PBR of 0.35x, but fails the earnings test with operating profit / market cap of 4.8%. Yet Muhak’s investment case rests not on earnings but on net cash larger than its market capitalisation. An earnings-yield filter is fundamentally a yardstick for earnings stories, so it structurally screens out companies whose asset value is the point. Asset plays have to be swept again with a separate set of eyes.
Case ③ A single day’s trading value is distorted — SCD. SCD fails stage ④ as of today, because trading value on the query date exceeded KRW 32bn. Yet as recently as 10 July this stock was trading KRW 200–400m a day (KRX measured: 10 Jul KRW 240m → 13 Jul KRW 24.3bn → 16 Jul KRW 32.1bn). Trading simply spiked over the last few days; the company did not “stop being an overlooked stock.” A single day’s trading value is only a proxy for normal liquidity, and shifting the run date by one day can flip the pass/fail outcome. Using average trading value softens the problem, but it remains a proxy in essence.
If you want to run this properly — practical notes. A few cautions for anyone planning to run this funnel themselves. Exchange sector classifications have missing values (808 in this run), so excluding financials and holding companies can leak even when you cross-check on company names; and I did not collect flags for administrative issue designation, investment-alert status or trading suspension, so those are the first things worth checking when you open up a candidate. Three companies for which the DART query came back empty were treated as failures.
Analysis begins where the numbers stop
These cases all say the same thing. The funnel produces candidates, not conclusions. There are companies at the start of a recovery that sit outside the filter, like Whanin Pharmaceutical; asset plays for which the yardstick itself does not fit, like Muhak; and companies bounced out by a single day’s difference in run date, like SCD. Conversely, inside the 207 there is distress on the verge of administrative designation, controlling-shareholder risk, and optical illusions manufactured by one-off gains.
So The Accidental Order’s actual work starts after the funnel. I pick a company out of the candidate pool, read the DART primary sources (five years of annual reports, 24 months of filings), work out the business structure and its pressure points, and then set out a verifiable scenario — numerical thresholds and falsification conditions — and publish. Publication is not the end: the company goes onto the tracking ledger and gets an update every quarter. The “direction” and “quality” a mechanical filter misses are what this tracking process catches.
Put the other way round, this funnel can be run again every quarter. Every time prices and accounts refresh, the list of names that pass changes, and that change is itself information — which companies newly entered, and which dropped out because an earnings recovery made them no longer cheap.
The analyses that came out of this funnel
Every analysis of an overlooked stock published so far came up as a candidate in an earlier run of this screening process and was then selected after qualitative review. Grouped by type, you can see how differently each one passed through the layers of the funnel.
- Muhak (033920) — asset play. Net cash larger than market capitalisation. PBR of 0.35x as of today
- Cuckoo Homesys (284740) — earnings story. Still clears all the way to ⑥ in today’s run (retained)
- Osung Advanced Materials (052420) — earnings story. Still clears all the way to ⑥ in today’s run (retained)
- Whanin Pharmaceutical (016580) — earnings story. Outside the earnings-yield threshold as of today (case ①)
- SCD (042110) — asset play. Outside the filter as of today because of the spike in trading value (case ③)
The point of this list is that five companies stand in five different relationships to the funnel. Two are inside the filter today; three are outside it for three different reasons — and those “reasons for being outside” line up exactly with the central argument of each analysis (earnings rebound, net cash, a trading spike). The story lives where the machine loses the thread. Whether the scenarios they set out actually hold gets its first update during this earnings season.
The list of 207 candidates is not published. Releasing names that have not yet been through review would amount to the very thing The Accidental Order has decided not to do — reciting company names without a basis. Names from the list are published one at a time, as in the list above, once review has turned them into an analysis.
Principles for running the funnel — three likely questions
“Why not measure neglect by the number of research reports?” Coverage data differs depending on who is compiling it and, above all, it lags. The fact that there is no research is already reflected in trading value. Trading value is primary data refreshed every day, and I judged it the more honest yardstick even after accepting its limits as a proxy (case ③ above).
“Do you not backtest?” This funnel is not a strategy that promises returns; it is a tool for choosing what to read. Backtests such as “the historical return of a sub-0.5x PBR portfolio” suffer badly from survivorship bias and liquidity illusion (overlooked stocks often cannot actually be bought at backtest prices), so even when run they are not used for more than reference. The verification The Accidental Order has chosen instead is pre-registration — writing down the thresholds for each company in advance and publishing updates on the tracking ledger. If a backtest verifies the past, this method verifies the future.
“How often do you re-run the funnel?” Every quarter. That matches the cycle on which the accounting data (the numerators in ⑤ and ⑥) refreshes through quarterly reports, and each run will record the reference date and the pass counts and publish them as this article does. Changes in the list — names that newly entered, names that dropped out because an earnings recovery made them no longer cheap — are themselves a map of the next batch of analysis candidates.
How to reproduce this
This funnel can be reproduced from public data alone. Prices, market capitalisation and trading value come from the KRX Information Data System (this article uses the 2026-07-17 closing snapshot); financials come from the key accounts of the 2025 annual report via the DART electronic disclosure OpenAPI (consolidated where available, separate as substitute). The delisting lines follow the Financial Services Commission’s published schedule. Stages ① to ④ were computed from the price snapshot alone; ⑤ and ⑥ from a full DART pull across all 1,003 candidates. The filter thresholds (market cap KRW 1tn, trading value KRW 500m, PBR 0.5x, earnings yield 10%) are design choices made by The Accidental Order, and other values would give a different funnel — what matters is that whatever values you use, you fix them in advance and do not move them afterwards.
Three-line summary
One. In a market where the delisting market-cap standard is rising in steps, The Accidental Order narrows 2,765 companies to 207 through a six-layer filter of “above the survival line + outside coverage + operating profit positive + half of book” — every threshold and every stage-by-stage measured count is published in this article. Two. The medians of the surviving 207 are market cap KRW 86.9bn, PBR 0.34x and an earnings yield of 23.8% — the existence of hundreds of companies at prices like these is the reason analysis of overlooked stocks exists. Three. What caught Whanin Pharmaceutical, Muhak and SCD outside the filter was not the machine but reading — the machine makes the candidates; the analysis and the public tracking make the conclusions.
Sources and disclosure
Sources for the figures: KRX prices (2026-07-17 close, queried 2026-07-18), the DART electronic disclosure OpenAPI (key accounts of the 2025 annual report), and the Financial Services Commission’s delisting-regime reform plan. All stage figures are measured as at the date of writing and will change as prices and accounts are updated.
This article is for informational purposes and is not a recommendation to buy or sell any security. Every company mentioned is the subject of a previously published analysis, and target prices and trade timing are not addressed.
Related reading: What is an overlooked stock? · Overlooked stocks and charts — the liquidity trap · The traps in PER and PBR · An introduction to backtesting · Earnings season preview