How to Read Short-Selling Data: Balances, Share of Trading and Overheated Stocks
No subject in the Korean market generates more talk and less reading of the data than short selling. A regulatory history of repeated bans and resumptions has inflated the argument, and the argument is mostly consumed in the language of fear and conspiracy — “the big players are pushing the price down.” Yet short selling is not a matter for speculation: balances are disclosed, trades are tallied, overheated stocks are designated. It is thoroughly public data.
This article is about how to read that data: the minimum regulatory context, where to find what, the meaning and the traps of each indicator, and how short-selling data can be used on thinly traded names such as the overlooked stocks we looked at earlier.
1. The minimum regulatory context
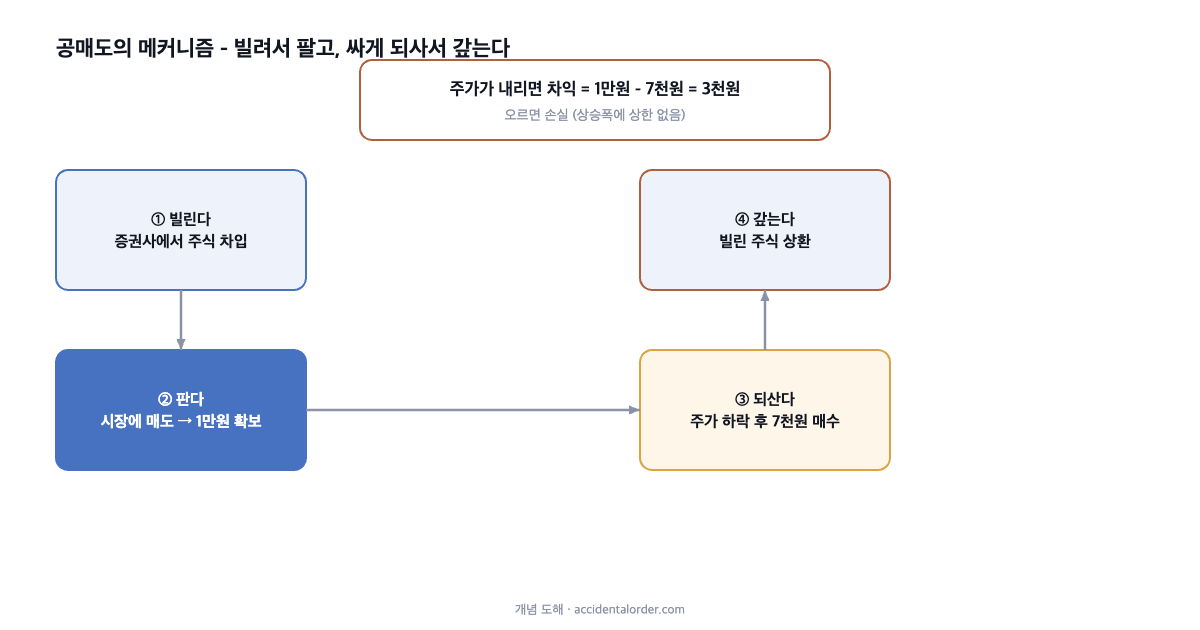
Short selling is the practice of borrowing shares, selling them first, and buying them back later to repay the loan. It has a useful side — contributing to price discovery and liquidity — and a harmful one — accelerating declines and serving as a vehicle for unfair trading — so the rules around it are dense. Korea has traced an unparalleled trajectory: a total ban during the Covid crash of March 2020 → a partial resumption limited to the KOSPI 200 and KOSDAQ 150 indices in May 2021 → another total ban in November 2023 → a full resumption on 31 March 2025. This history itself matters for interpreting the data: the universe of stocks that could be sold short differed from period to period, so whenever you compare historical data you must check which regulatory phase it belongs to.
2. Where the data is
| Data | Publication frequency | Where to find it |
|---|---|---|
| Short-selling turnover and volume by stock | Daily | KRX information data system |
| Short interest (balance as % of shares outstanding) | When the disclosure threshold is met (published T+2) | KRX; the Financial Supervisory Service’s electronic disclosure system |
| Disclosure of large short-position holders | Positions of 0.5% or more | Financial Supervisory Service filings |
| Designation as a short-selling overheated stock | After the close on the day | KRX announcements |
| Securities lending balance | Daily | Korea Financial Investment Association statistics |
All of it is free. Most of it is also built into brokerage trading platforms as menu items, but checking the definition of the raw data once at the source (KRX) will save you from misreading it.
3. How to read the three key indicators
Short interest: the size of the accumulated bet
The short-selling balance is the volume of shorts not yet repaid — the total of open bets on a decline. A high balance relative to shares outstanding means that much money wagered on a fall has piled up. What matters is the trend rather than the absolute level: if the balance is rising steadily while the share price holds, that signals a tug-of-war in progress; if the balance drops sharply, it means the short sellers have been closing out (short covering).
Share of trading: today’s pressure
The proportion of total turnover accounted for by short selling is a breakdown of the day’s selling pressure. When a stock that normally runs at 2–3% suddenly prints 15%, something has changed — bad news, hedging against a convertible bond issue, or pre-emptive selling by someone with an information advantage. The data will not tell you which, so the correct use is as a trigger to go and check the filings and the news.
Securities lending balance: the size of the ammunition
Because you have to borrow the shares before you can short them, the securities lending balance is the potential ammunition for short selling. Lending also serves purposes other than short selling, however (ETF creation, settlement and so on), so a rising lending balance cannot be equated with an announcement of shorting to come. It is a supplementary indicator that only acquires meaning when read alongside short interest and the share of trading.
4. Overheated-stock designation: the market’s circuit breaker
When short selling piles abnormally into a stock, the exchange designates it a short-selling overheated stock and bans short selling in it for the following trading day. The designation criteria are a combination of the short-selling share of turnover, the fall in the share price and the rate of increase in that share, and they differ between the markets (KOSPI and KOSDAQ). From an investor’s point of view the designation notice reads in two ways: in the short term, a pause in selling pressure; but fundamentally, a strong signal that “something is going on with this stock.” Reading the designation itself as good news and piling in is reading the signal backwards.
5. Four common misreadings
First, “high short interest = it is about to fall” is wrong. The balance is a bet already made, and a high balance can instead become the fuel for a short-covering rally (a short squeeze) once the bad news is exhausted. Second, “short selling is why my stock is falling” is usually a confusion of cause and effect — short selling is more often a reaction to the reasons for a decline (overvaluation, deteriorating earnings) than the cause of it. Third, arguments that mix up naked short selling (illegal) with covered short selling (legal) ruin any interpretation of the data. Fourth, short-interest disclosure arrives late, on a T+2 basis — the balance on your screen today is the world of two days ago.
6. A practical workflow: the five-minute check
| Order | Check | Point of judgement |
|---|---|---|
| 1 | Trend in short interest (3–6 months) | Is the accumulated bet building up or unwinding? |
| 2 | Recent spikes in the short-selling share of trading | How many times the usual level? What news or filings came that day? |
| 3 | Direction of the securities lending balance | Is the ammunition increasing? |
| 4 | History of overheated-stock designations | Repeated designations suggest a structural issue |
| 5 | Filings on convertible bonds and rights issues | The usual cause of hedging-driven short selling |
Number 5 in particular is the crux in practice. A surge in short selling in a stock that has issued convertible bonds (CBs) is frequently not a directional bet but hedging by the CB investors — half of what look like signals is mechanical flow of this kind.
7. Anatomy of a short squeeze: the moment the balance becomes fuel
Let us nail down the most counter-intuitive point in reading short-selling data — that a high balance is not a prophecy of decline but sometimes the fuel for a surge — with a case. The GameStop (GME) episode in the United States in January 2021 is the textbook example. At the time, short interest in the stock had piled up to more than 100% of the free float. When retail investors’ concentrated buying started to lift the price, short holders were forced to buy to cut their losses (short covering), because the structure of a short position leaves losses open without limit (the maximum loss on a short is theoretically infinite) — and that buying pushed the price higher still, setting off an explosive feedback loop. Within a few weeks the price had risen dozens of times over, then collapsed.
Generalising the mechanism: high short interest + a thin free float + an upward catalyst = a squeeze candidate. In the Korean market too, the phenomenon of heavily shorted stocks rebounding with unusual violence on good news has the same structure. Hunting for squeezes as an investment strategy, however, is an entirely different matter: the timing is inherently unpredictable, and the retracement after a squeeze ends is brutal. Most of GameStop’s surge was given back within a few weeks. The fair conclusion is a double one: indispensable as a tool for reading data, playing with fire for advanced practitioners only as a trading strategy.
8. Going deeper: telling apart the false signals created by CBs
Having said in the main text that convertible bond (CB) hedging is the usual cause of a surge in short selling, let us set out the clues for distinguishing directional short selling from hedging short selling in practice.
| Clue | Smells like a directional bet | Smells like hedging flow |
|---|---|---|
| Timing | Moves together with bad news or a debate about overvaluation | Concentrated immediately after a CB issuance filing |
| Size | Balance accumulates gradually | A block proportional to the size of the issue |
| Price reaction | Sustained downward pressure | A tussle around the conversion price |
| Unwinding | Covered when the bad news passes | Disappears along with the conversion or redemption schedule |
CB hedging flow is not a view on the issuer’s fundamentals but mechanical selling to neutralise the delta of the conversion option. Read it as “the big players betting on a fall” and act on it, and you end up fighting an enemy that does not exist. Conversely, frequent CB issuance is itself a red flag of a different kind — it is often the last source of funding a company opens when bank loans and rights issues have become difficult, and the converted shares come back as dilution of existing shareholders’ stakes. This is the point at which you should be looking not at short-selling data but at the quality of the company’s funding.
9. How it is done abroad: a comparative view of the rules
| Item | Korea | United States | Japan and the EU (representative) |
|---|---|---|---|
| Retail access | Limited (retail stock-lending services expanding) | Active (routine through margin accounts) | Intermediate |
| Position disclosure | Disclosure at 0.5% or more | Mainly aggregate statistics (no individual disclosure) | EU has a similar 0.5% disclosure regime |
| Price restrictions | An uptick rule applies | The alternative uptick rule of 2010 (triggered by sharp falls) | Japan has a trigger-based uptick rule |
| History of outright bans | Four times: 2008, 2011, 2020, 2023 | A temporary ban limited to financial stocks in 2008 | Partial measures around 2008 |
The comparison offers two lessons. First, Korea is an exceptional market that has repeatedly imposed outright bans, so its data series is frequently interrupted — when comparing short interest or the share of trading against historical averages, you must line up the regulatory phases. Second, the asymmetry in retail access (the constraints on individuals’ short selling relative to institutions) is the heart of the fairness debate, and it is the background to the accompanying regulatory measures, such as the expansion of retail stock-lending supply, that came with the full resumption in 2025. The rules are a constantly moving target, so this table too needs to be re-checked against the regulations current at the time you read it.
Frequently asked questions
Q. Short interest in a stock I hold is rising. Should I sell?
A rising balance is a question, not an answer. The order of checks is: (1) is there a filing pointing to a mechanical cause such as a CB or a rights issue? (2) has the valuation run up sharply (creating an incentive to hedge against overvaluation)? (3) is there bad news in the industry or the earnings that I have missed? If the answer to all three is no, the balance is in fact future demand for short covering. The test is whether my own reason for holding still stands, not what someone else’s position is doing.
Q. How should data from the periods when short selling was banned be handled?
Falling balances and a shrinking share of trading during a ban are not information but the shadow of the rules. When backtesting or comparing with the past, mark the banned periods (March 2020 to the partial resumption in May 2021, November 2023 to March 2025, and so on), and as a matter of principle compare the absolute levels of indicators only within the same regulatory phase.
Q. Is short selling worth pursuing for profit as an individual?
You should start in the knowledge that it is a structurally disadvantaged game. Losses are theoretically unlimited, there are borrowing costs and the risk of a recall, and markets have an upward bias over the long run. If you hold a bearish view, reducing your holdings, raising cash, or making short-term and small-scale use of an inverse product are usually the more rational ways for an individual to express it than executing a short sale directly.
In closing
The value of short-selling data lies in it being a thermometer, not a prophecy. It is a public record, visible to every market participant, of how much money is positioned in the opposite direction on a stock and how fast it is moving. Use the thermometer as evidence for a conspiracy theory and you get nothing; use it as a trigger for cross-checking against filings and disclosures and it becomes one of the few areas where an individual investor is looking at the same screen as the institutions.
It reads well alongside the article on overlooked stocks, where thin trading leaves large traces of short selling; and if what you want before single-stock data of this kind is the skeleton of the account itself, the articles on asset allocation and risk come first. This is an area where the rules keep changing, so do not forget to check the current regulations before acting. Comments via the contact details on the About page.
This article is for general information purposes only and does not recommend the purchase or sale of any particular product. Investment decisions and the responsibility for them rest with the investor.